// Features
See how an examination runs from hypothesis to report.
ExaminerWorkbenchTM carries the examiner from suspected fraud schemes to the data, the tests, resolved exceptions, and a defensible report. These screens show a sample case built from demo data.
// Step 1
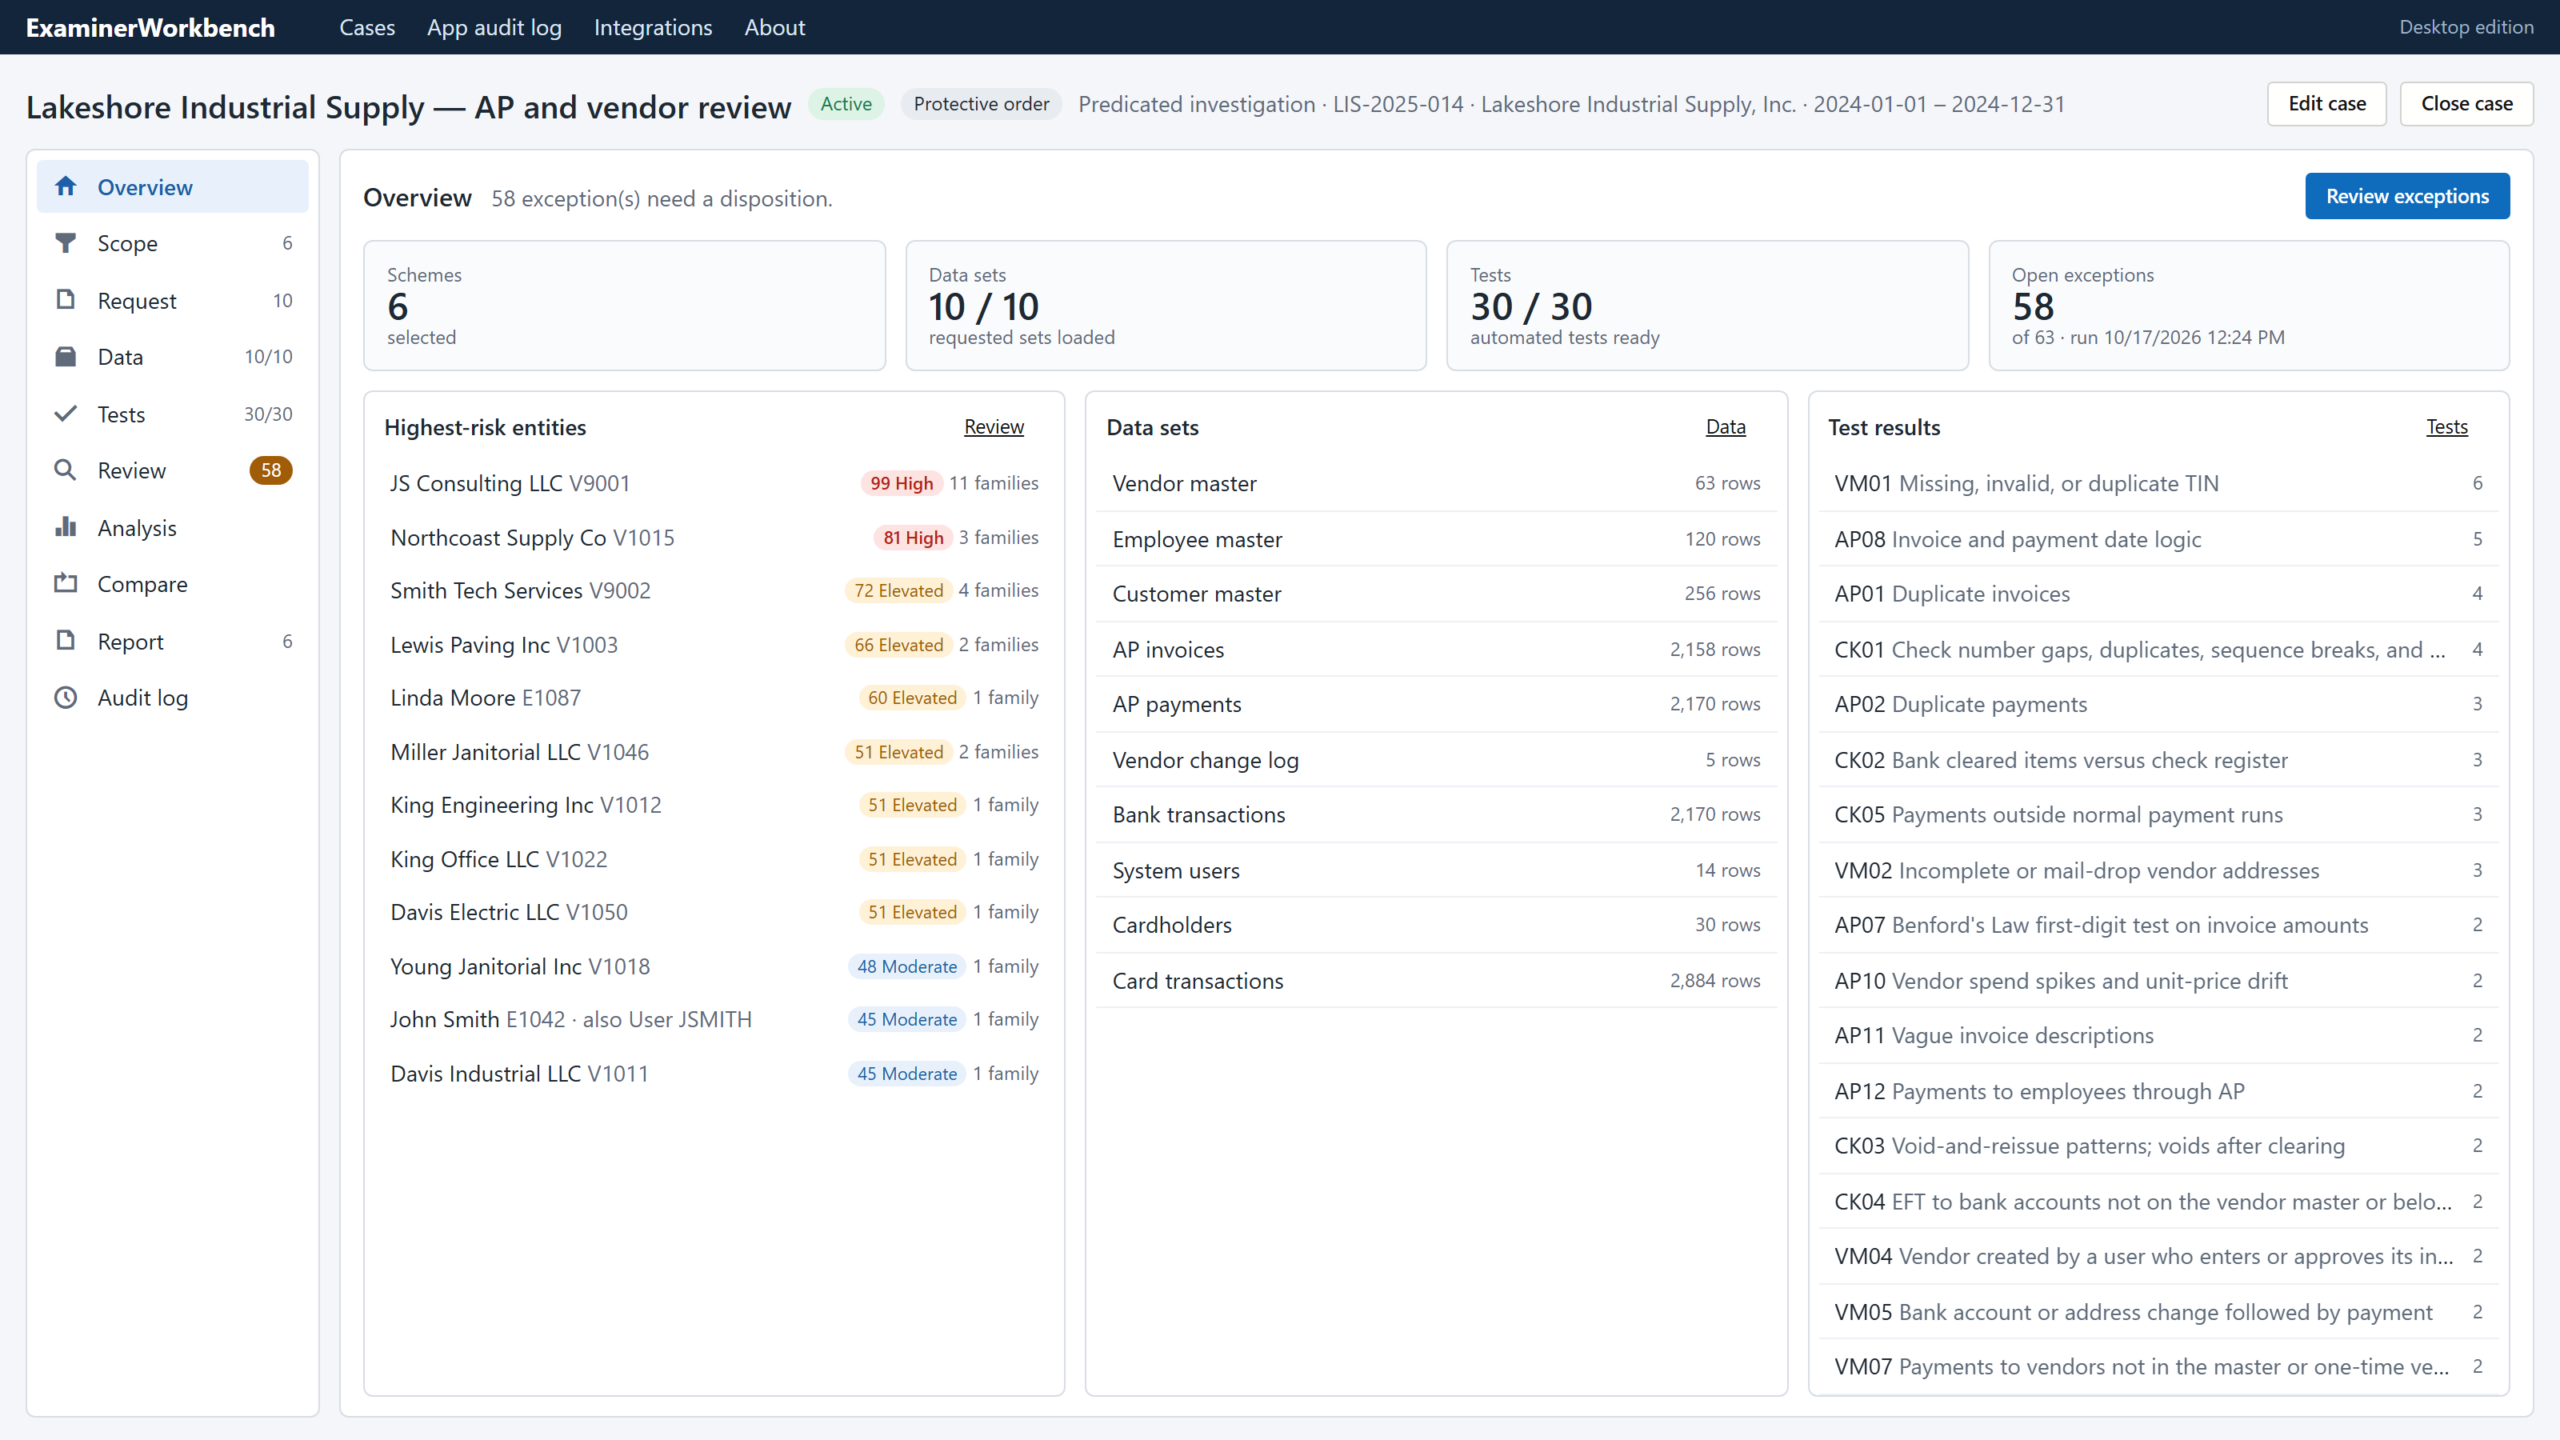
Start with the matter, not the data.
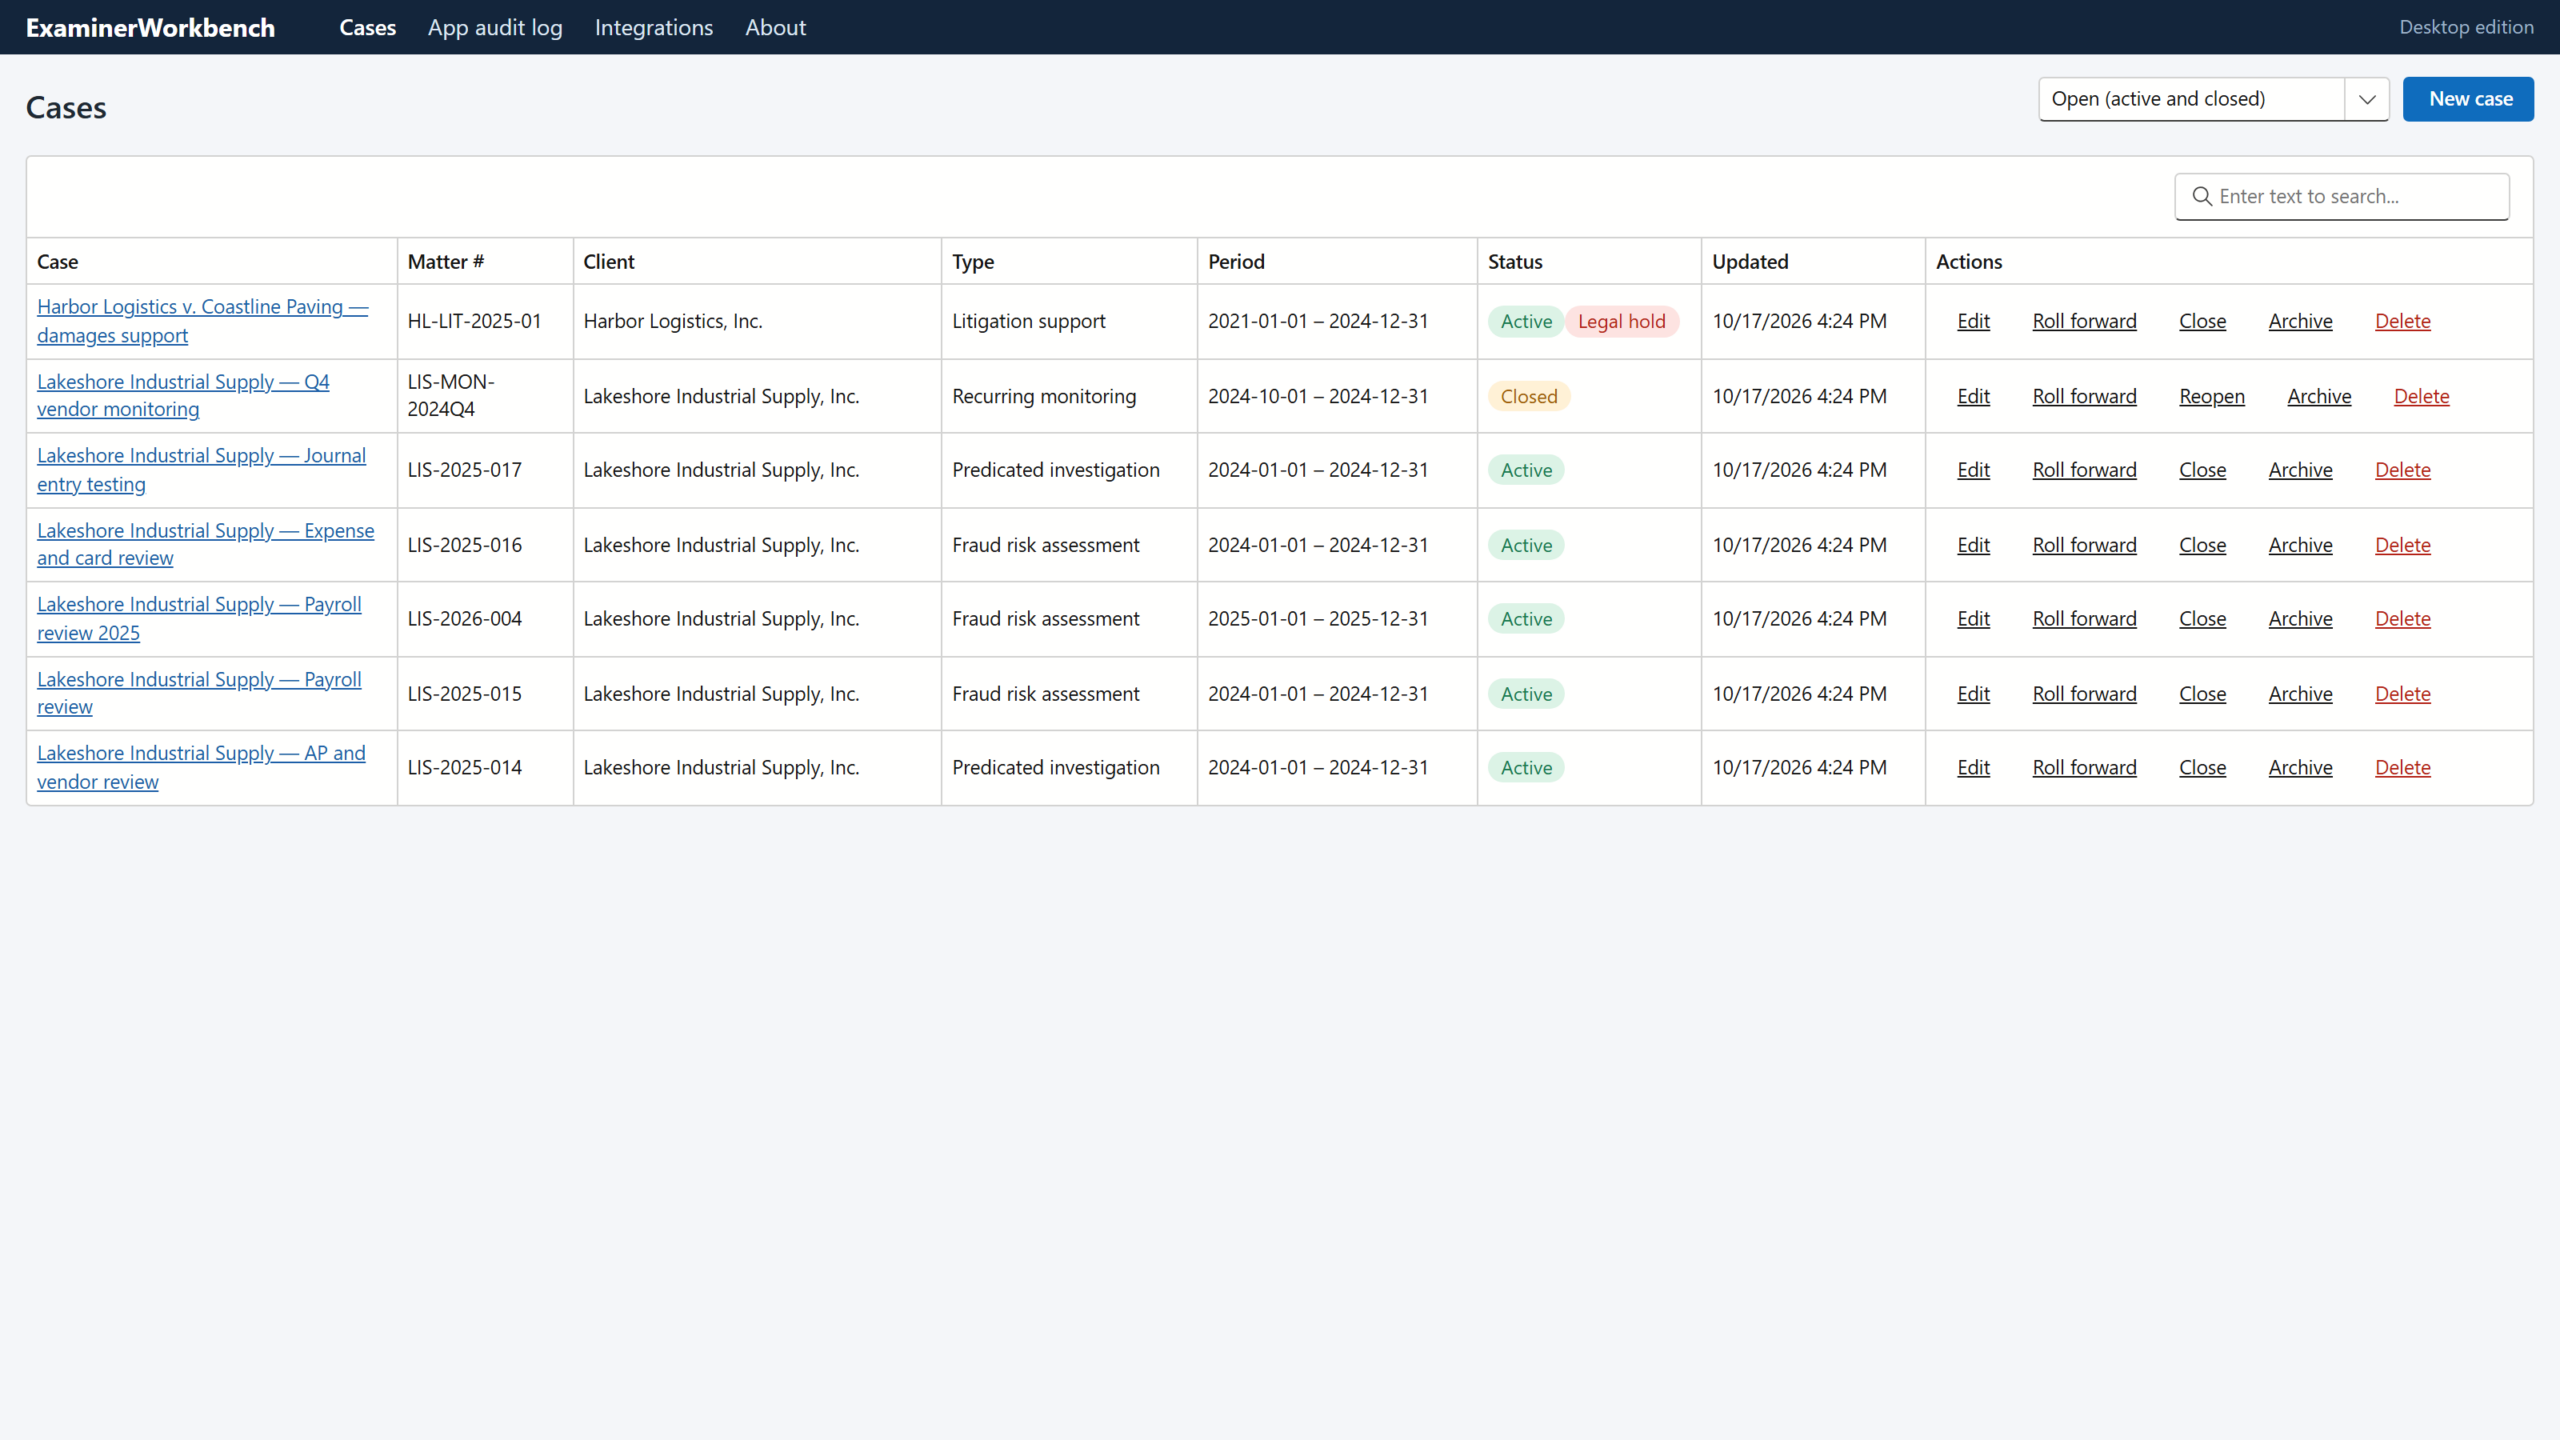
Open a case with its type, period, team, and confidentiality flags such as a protective order. Case parameters such as approval limits and thresholds belong to the case, so tests never rely on hard-coded values.
// Step 2
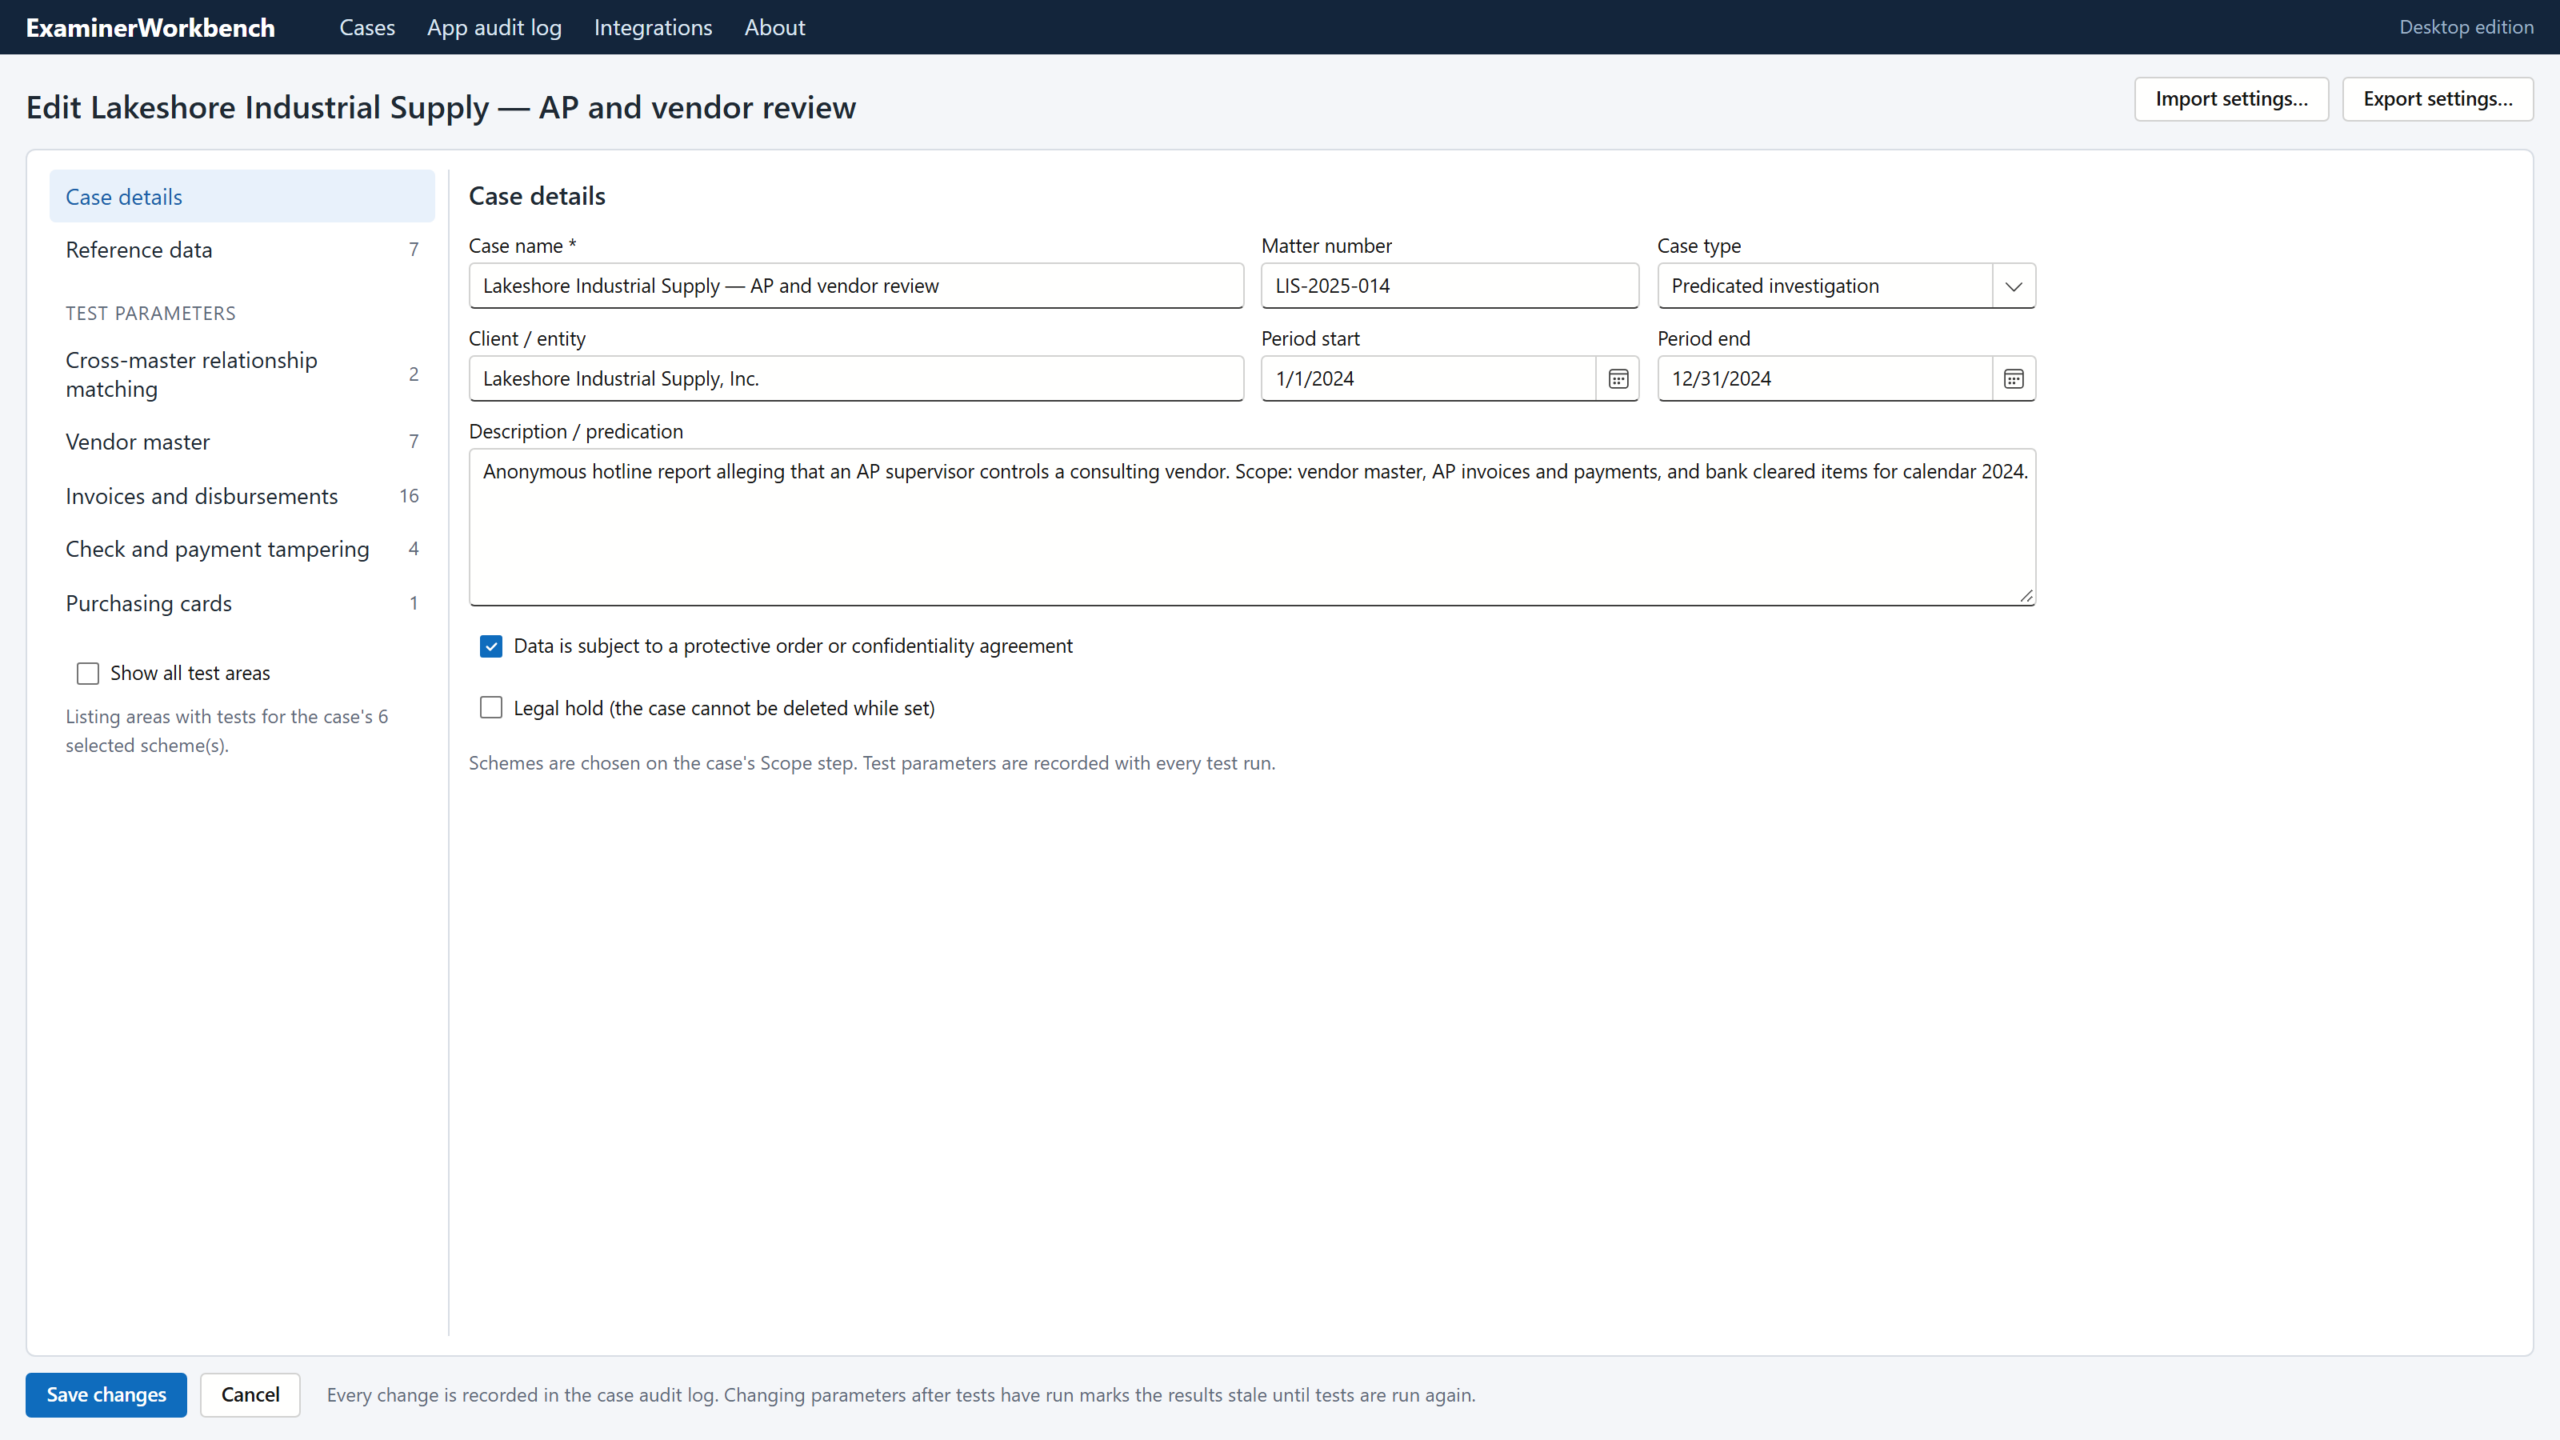
Choose the schemes you suspect or want to rule out.
Browse 31 fraud schemes with their red flags, the tests that apply, and a running preview of the data your selection will require. Start from a pack for a common engagement, then add or remove schemes.
// Step 3
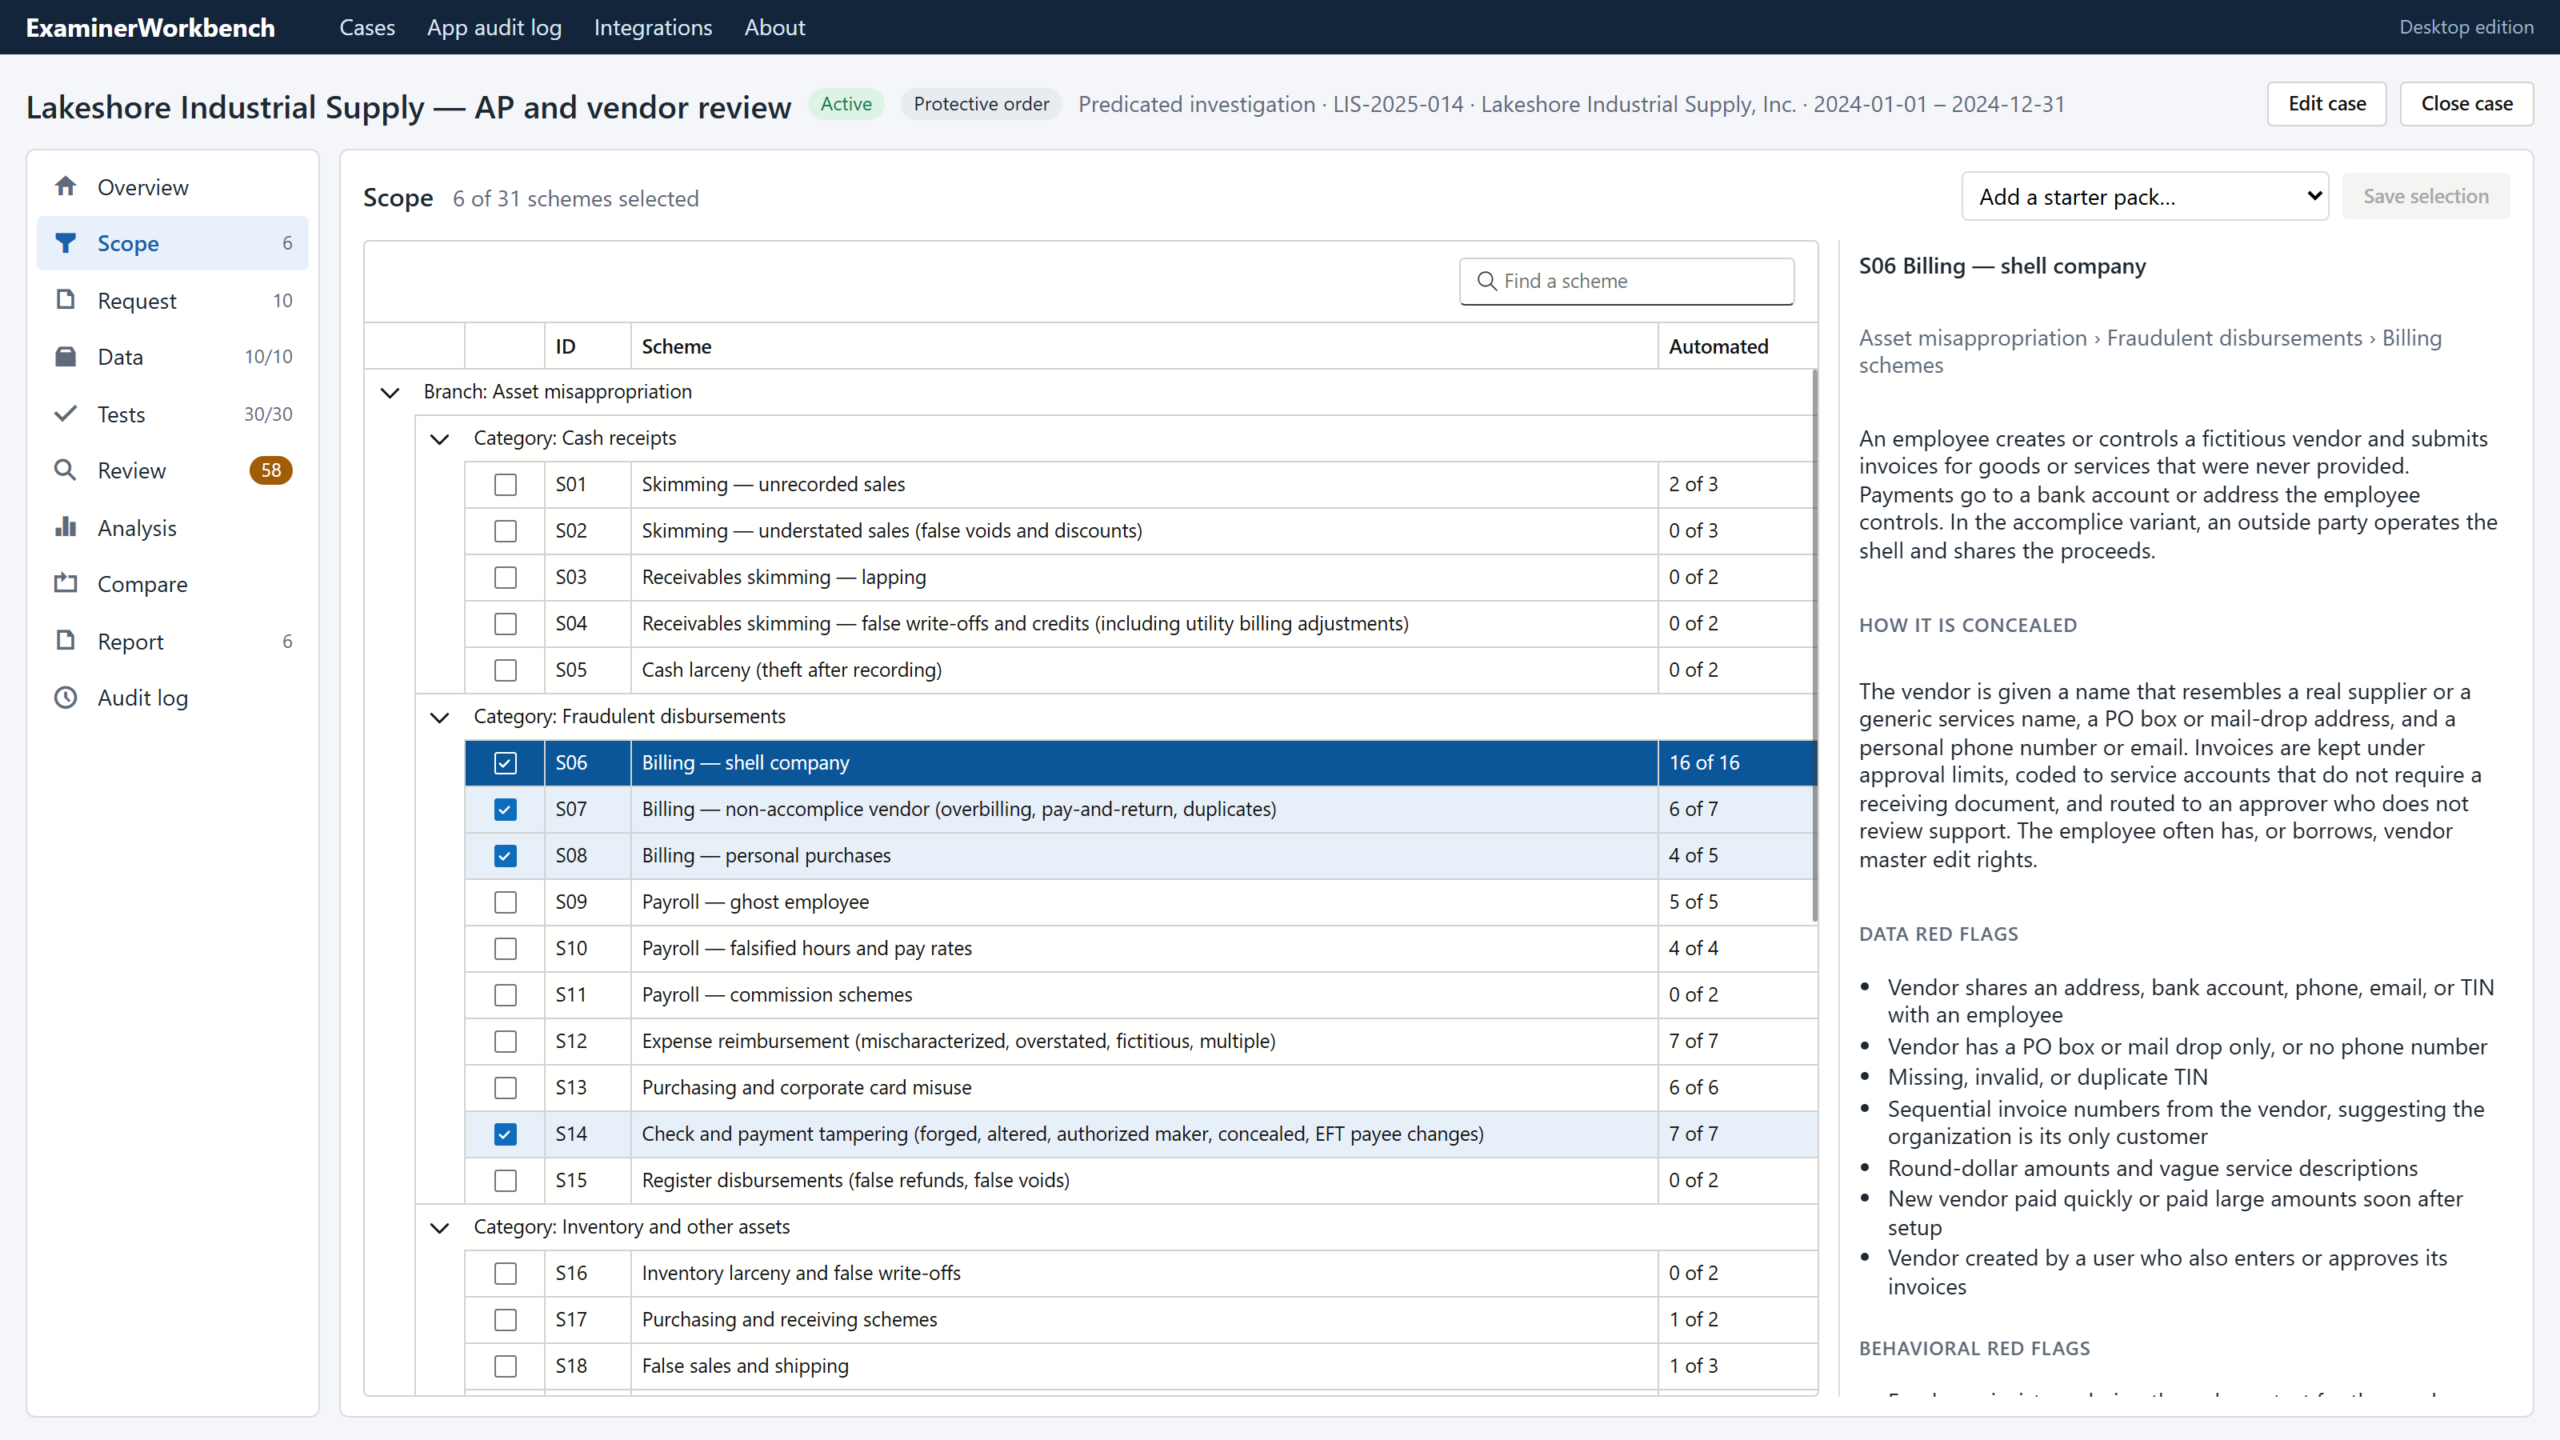
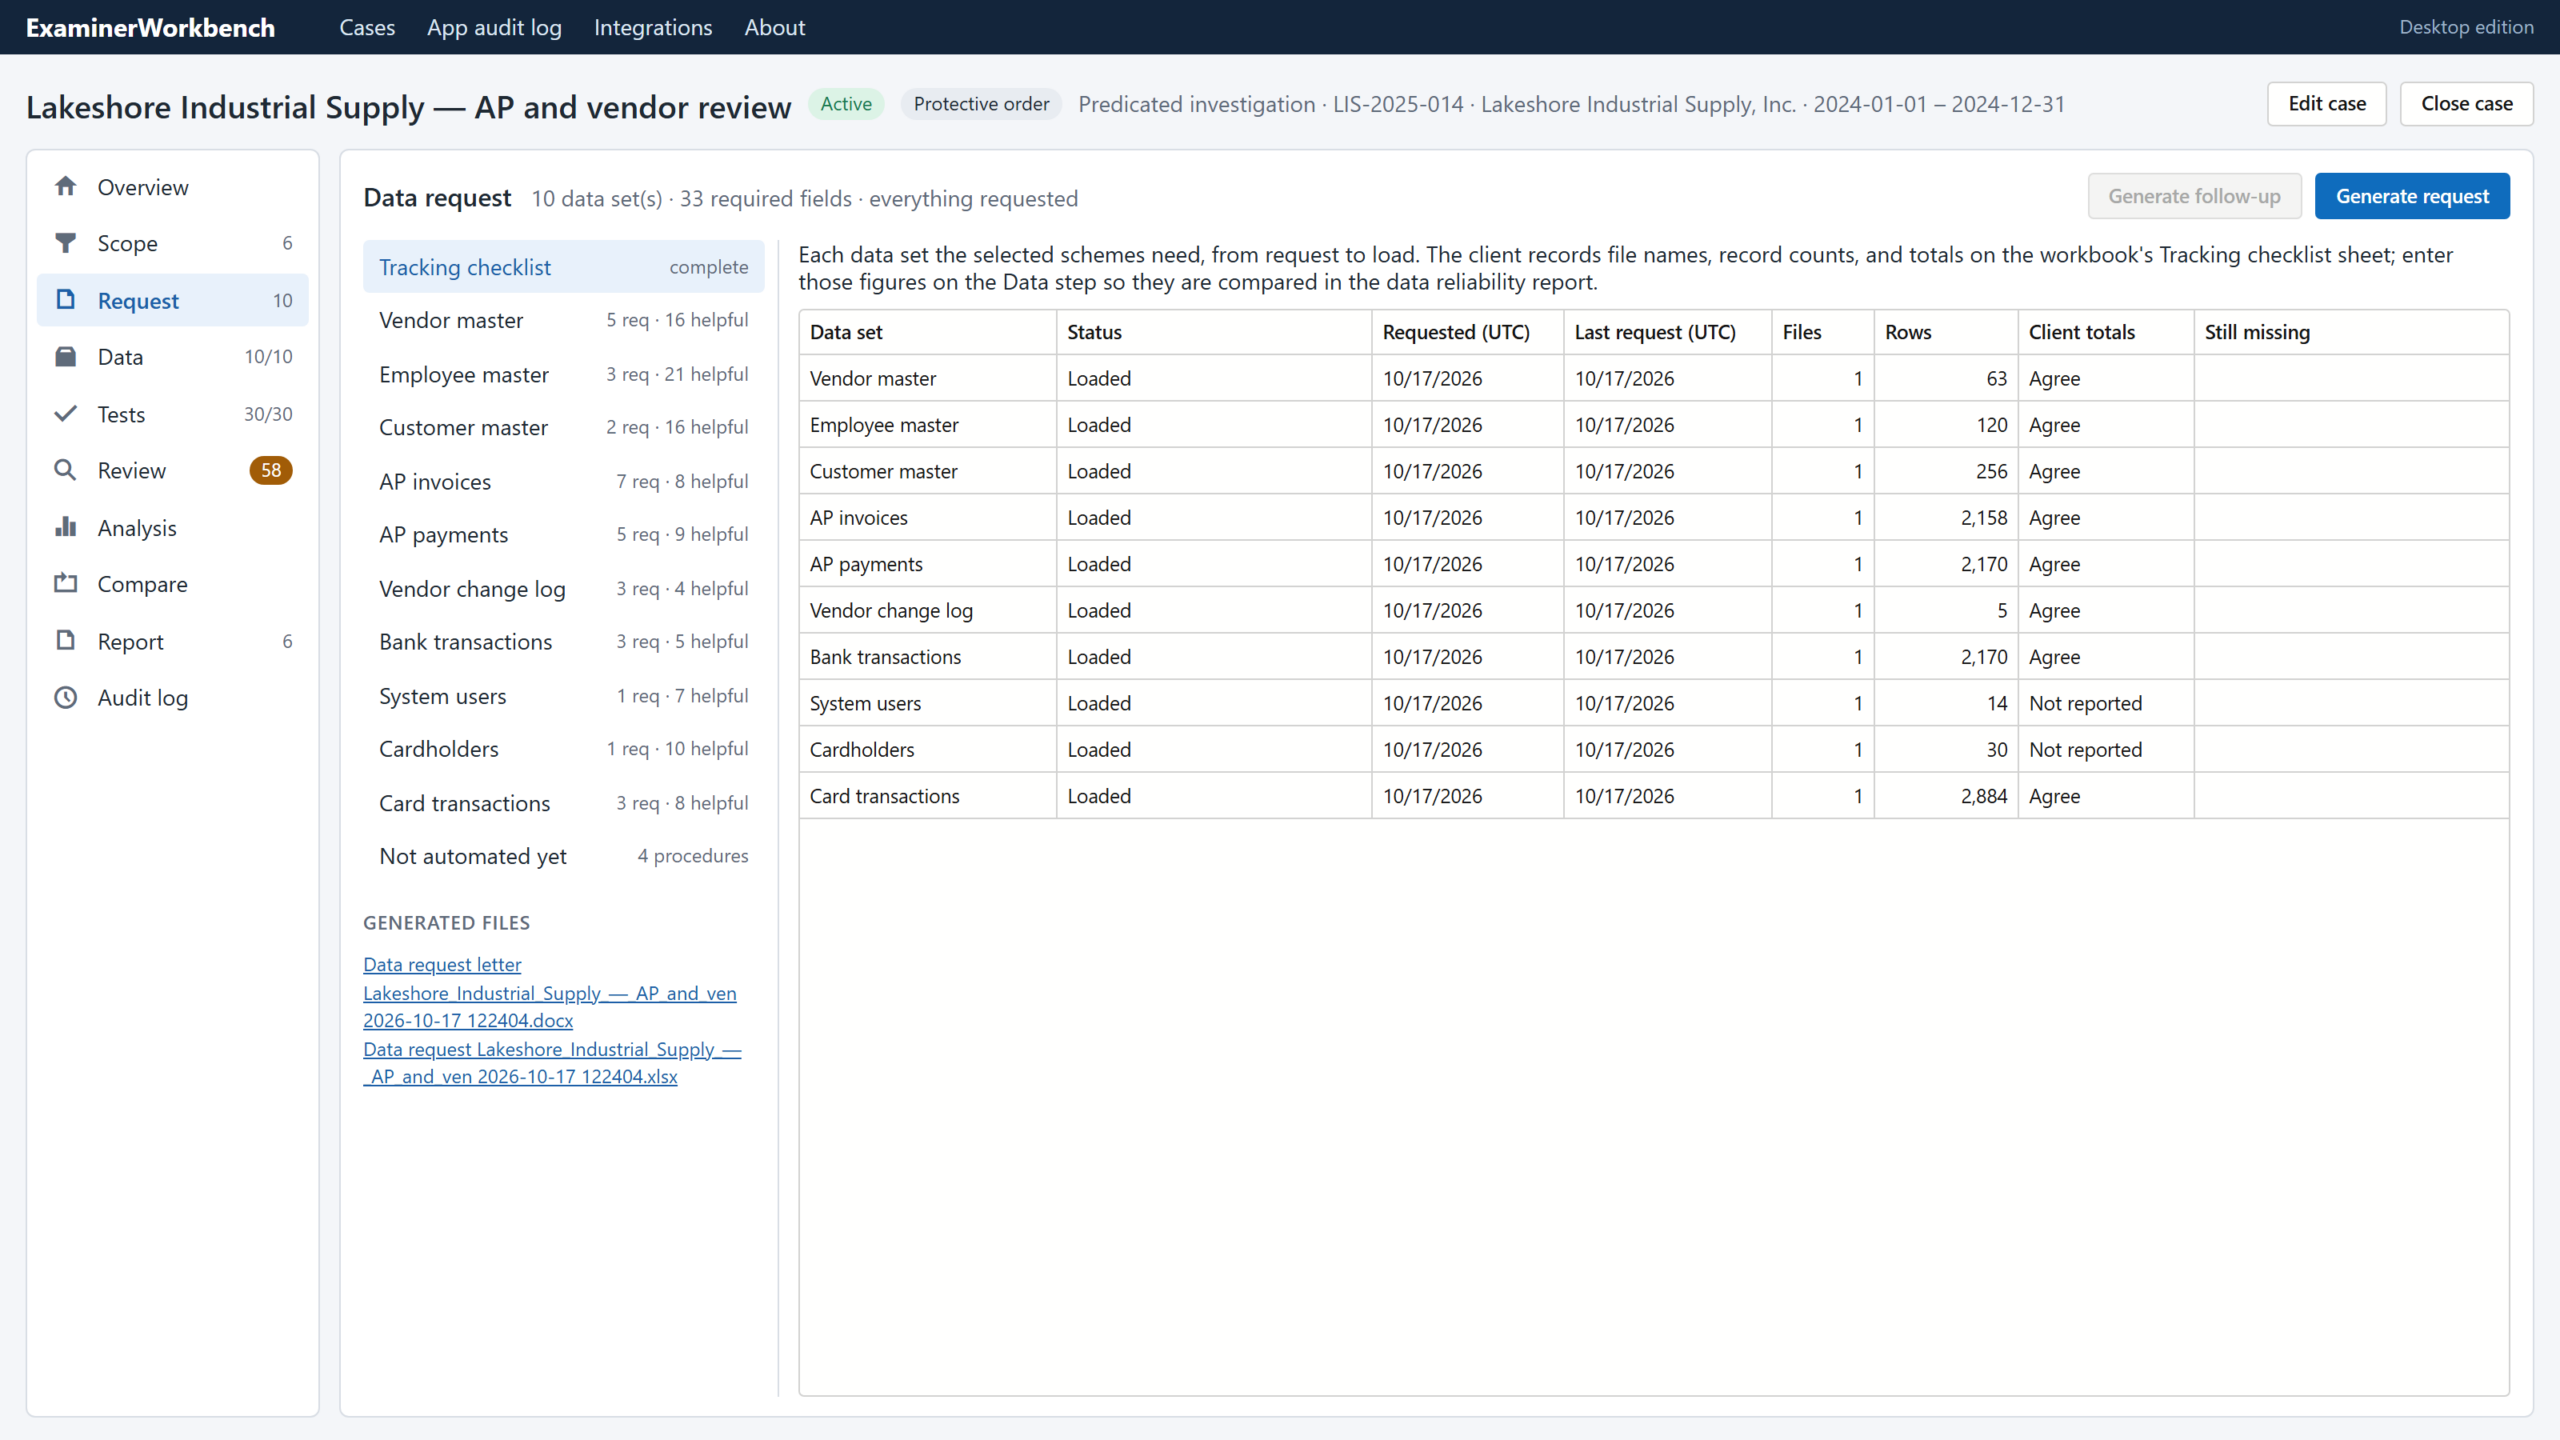
Ask the client for exactly what the tests need.
The data request is generated from your selection: a letter, an Excel specification and a tracking checklist. Adding a scheme later produces a request for only the new fields, and follow-up requests chase what is still missing.
// Step 4
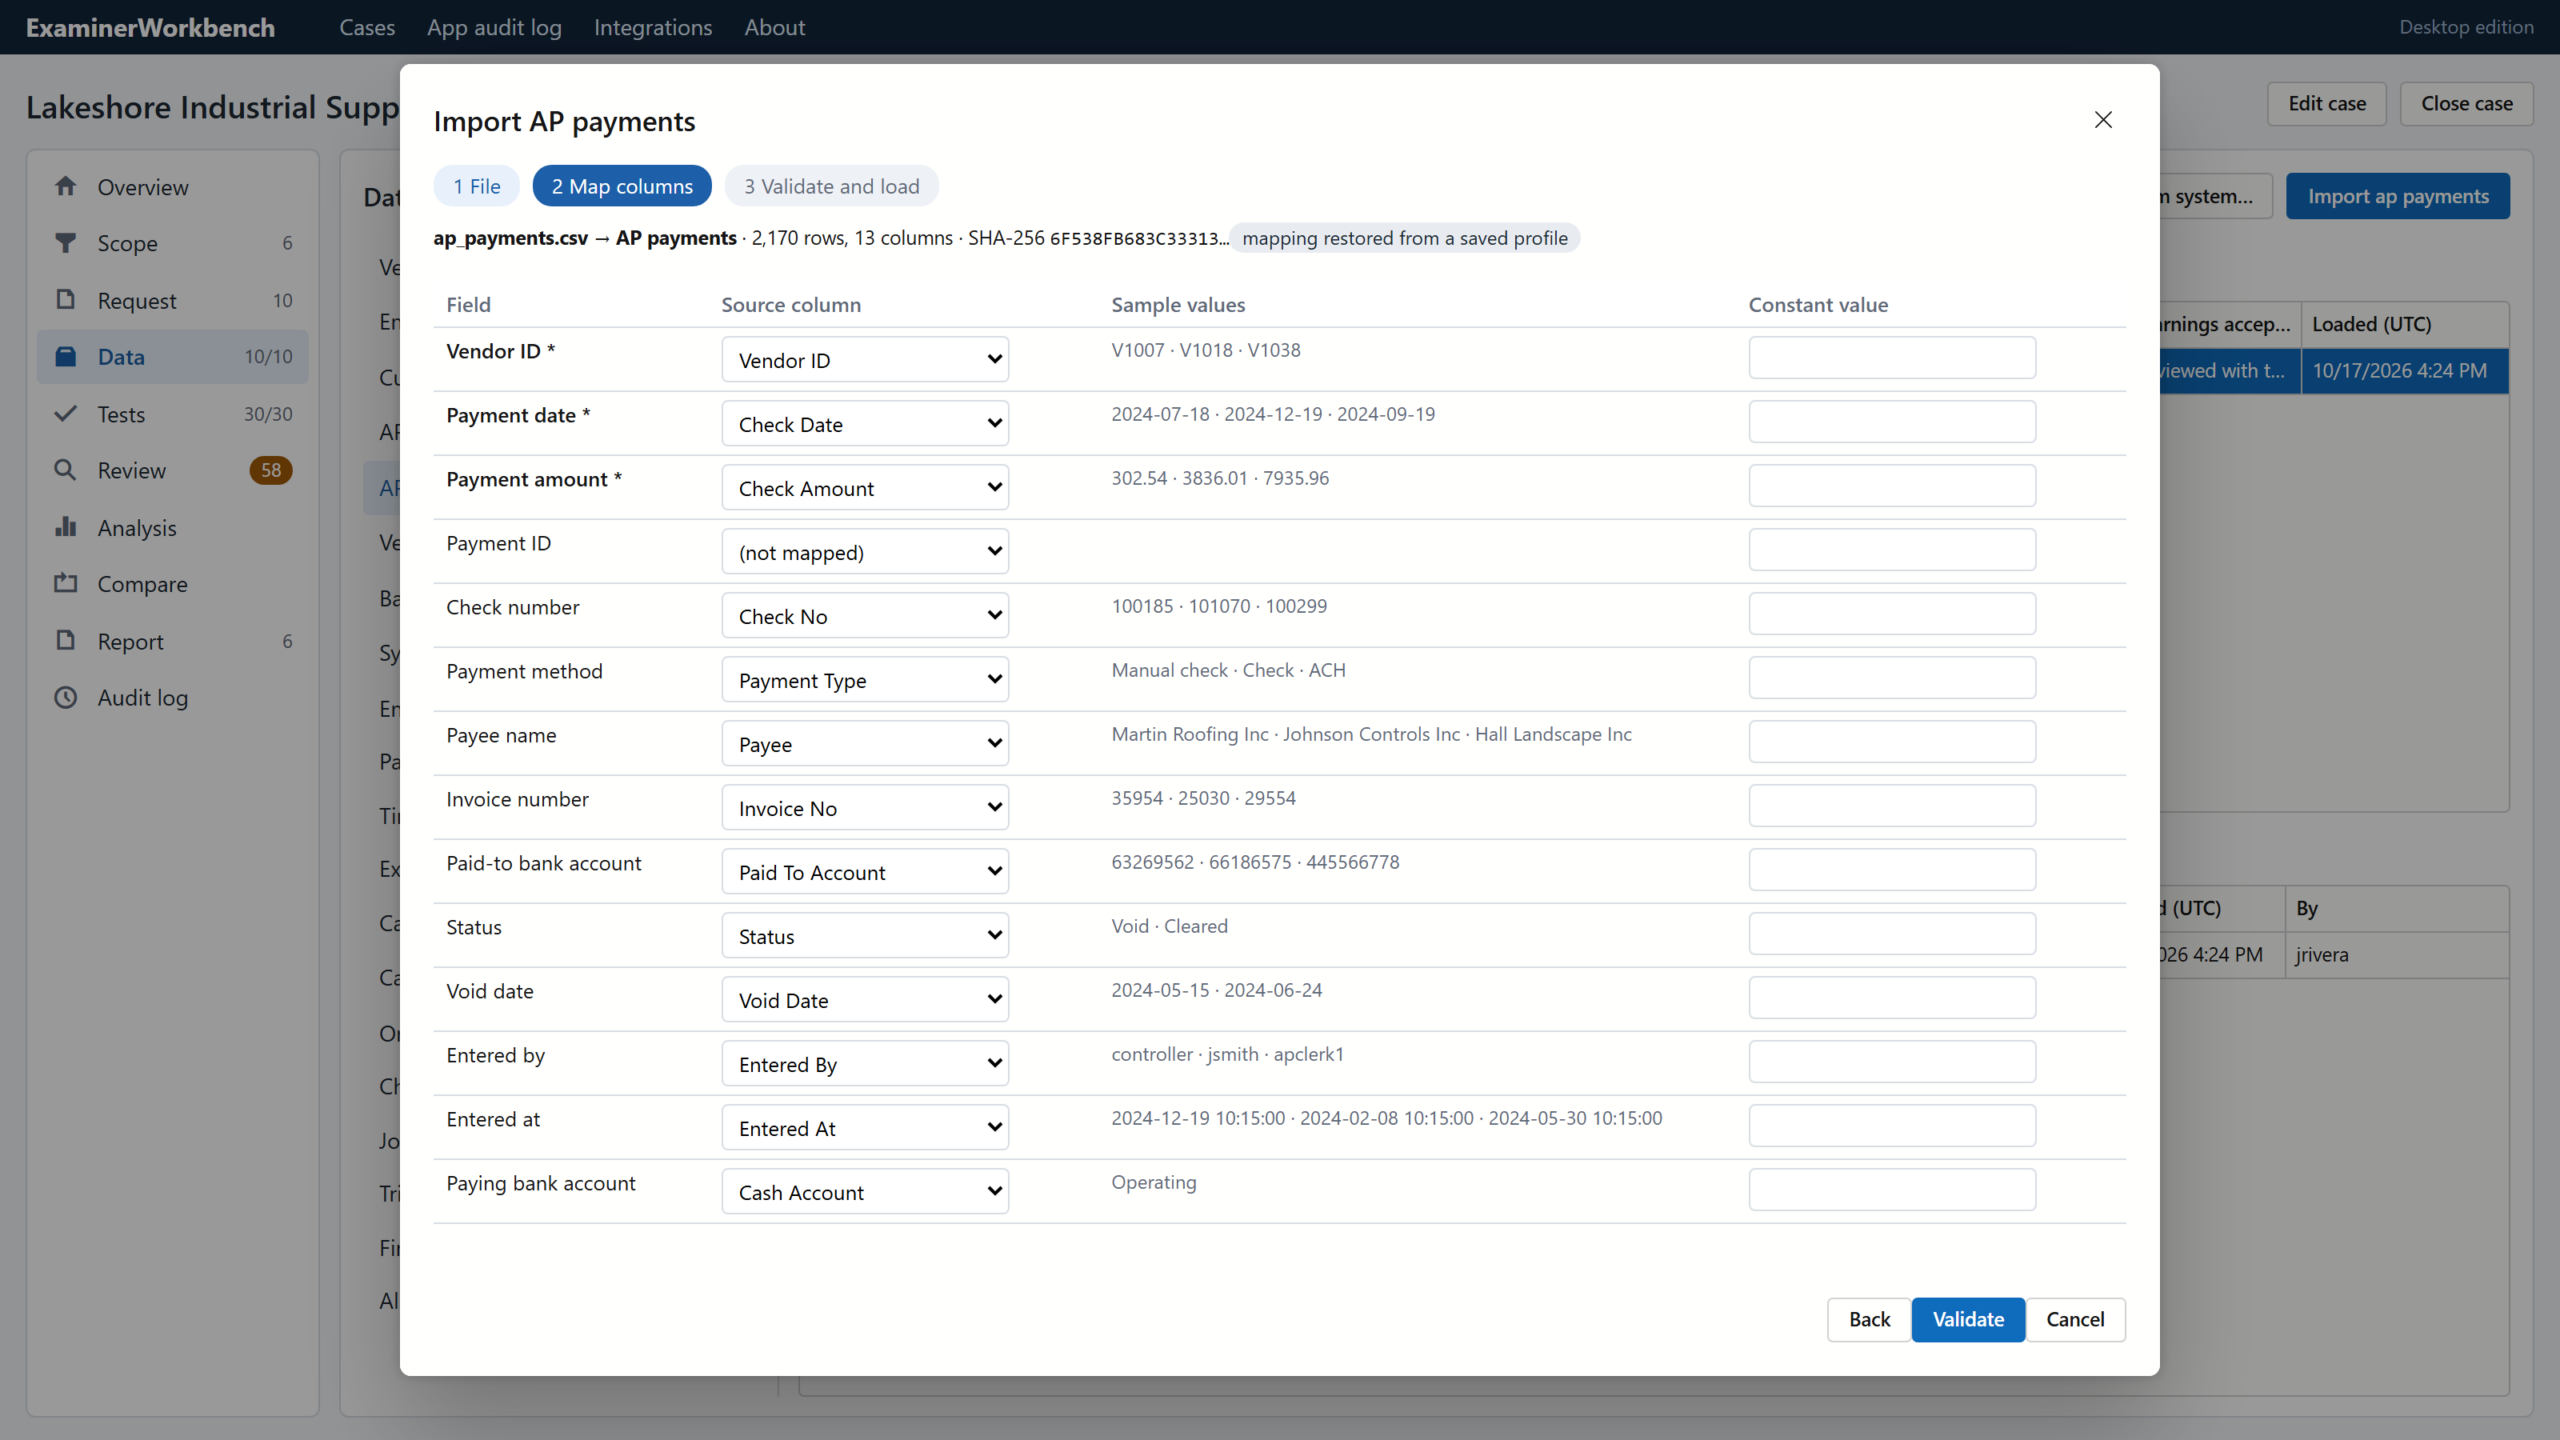
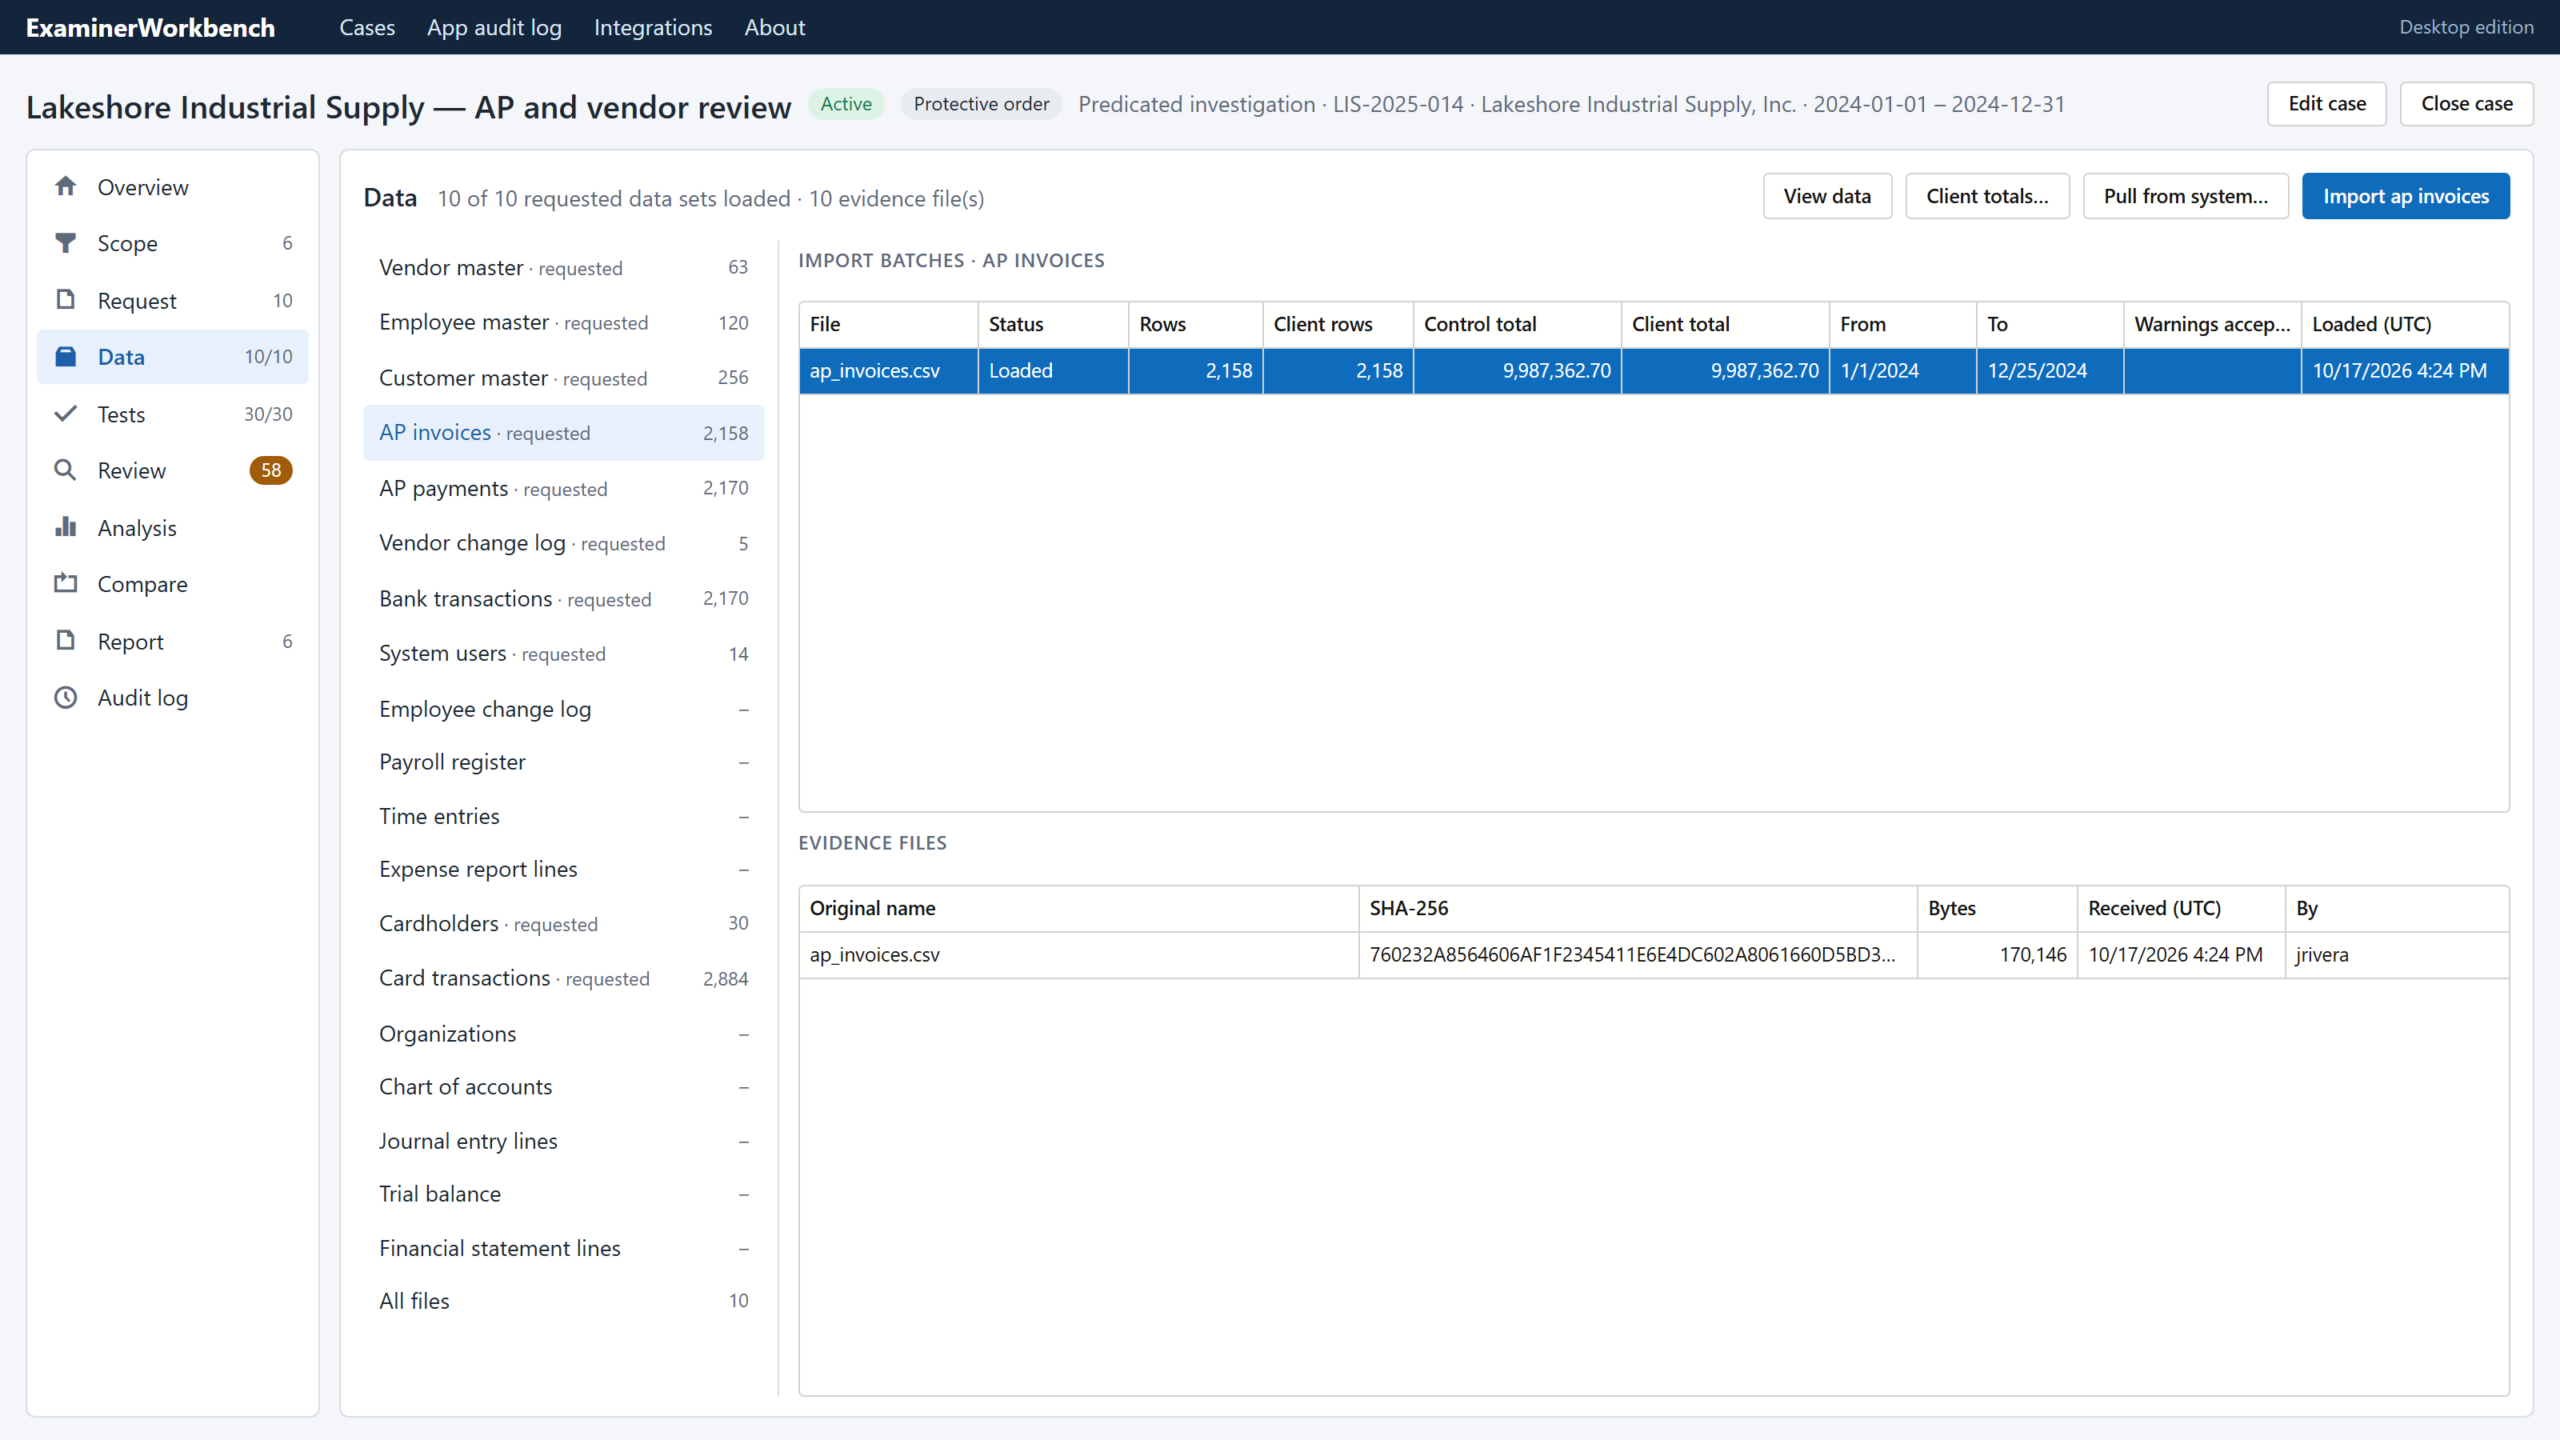
Data reliability comes before analysis.
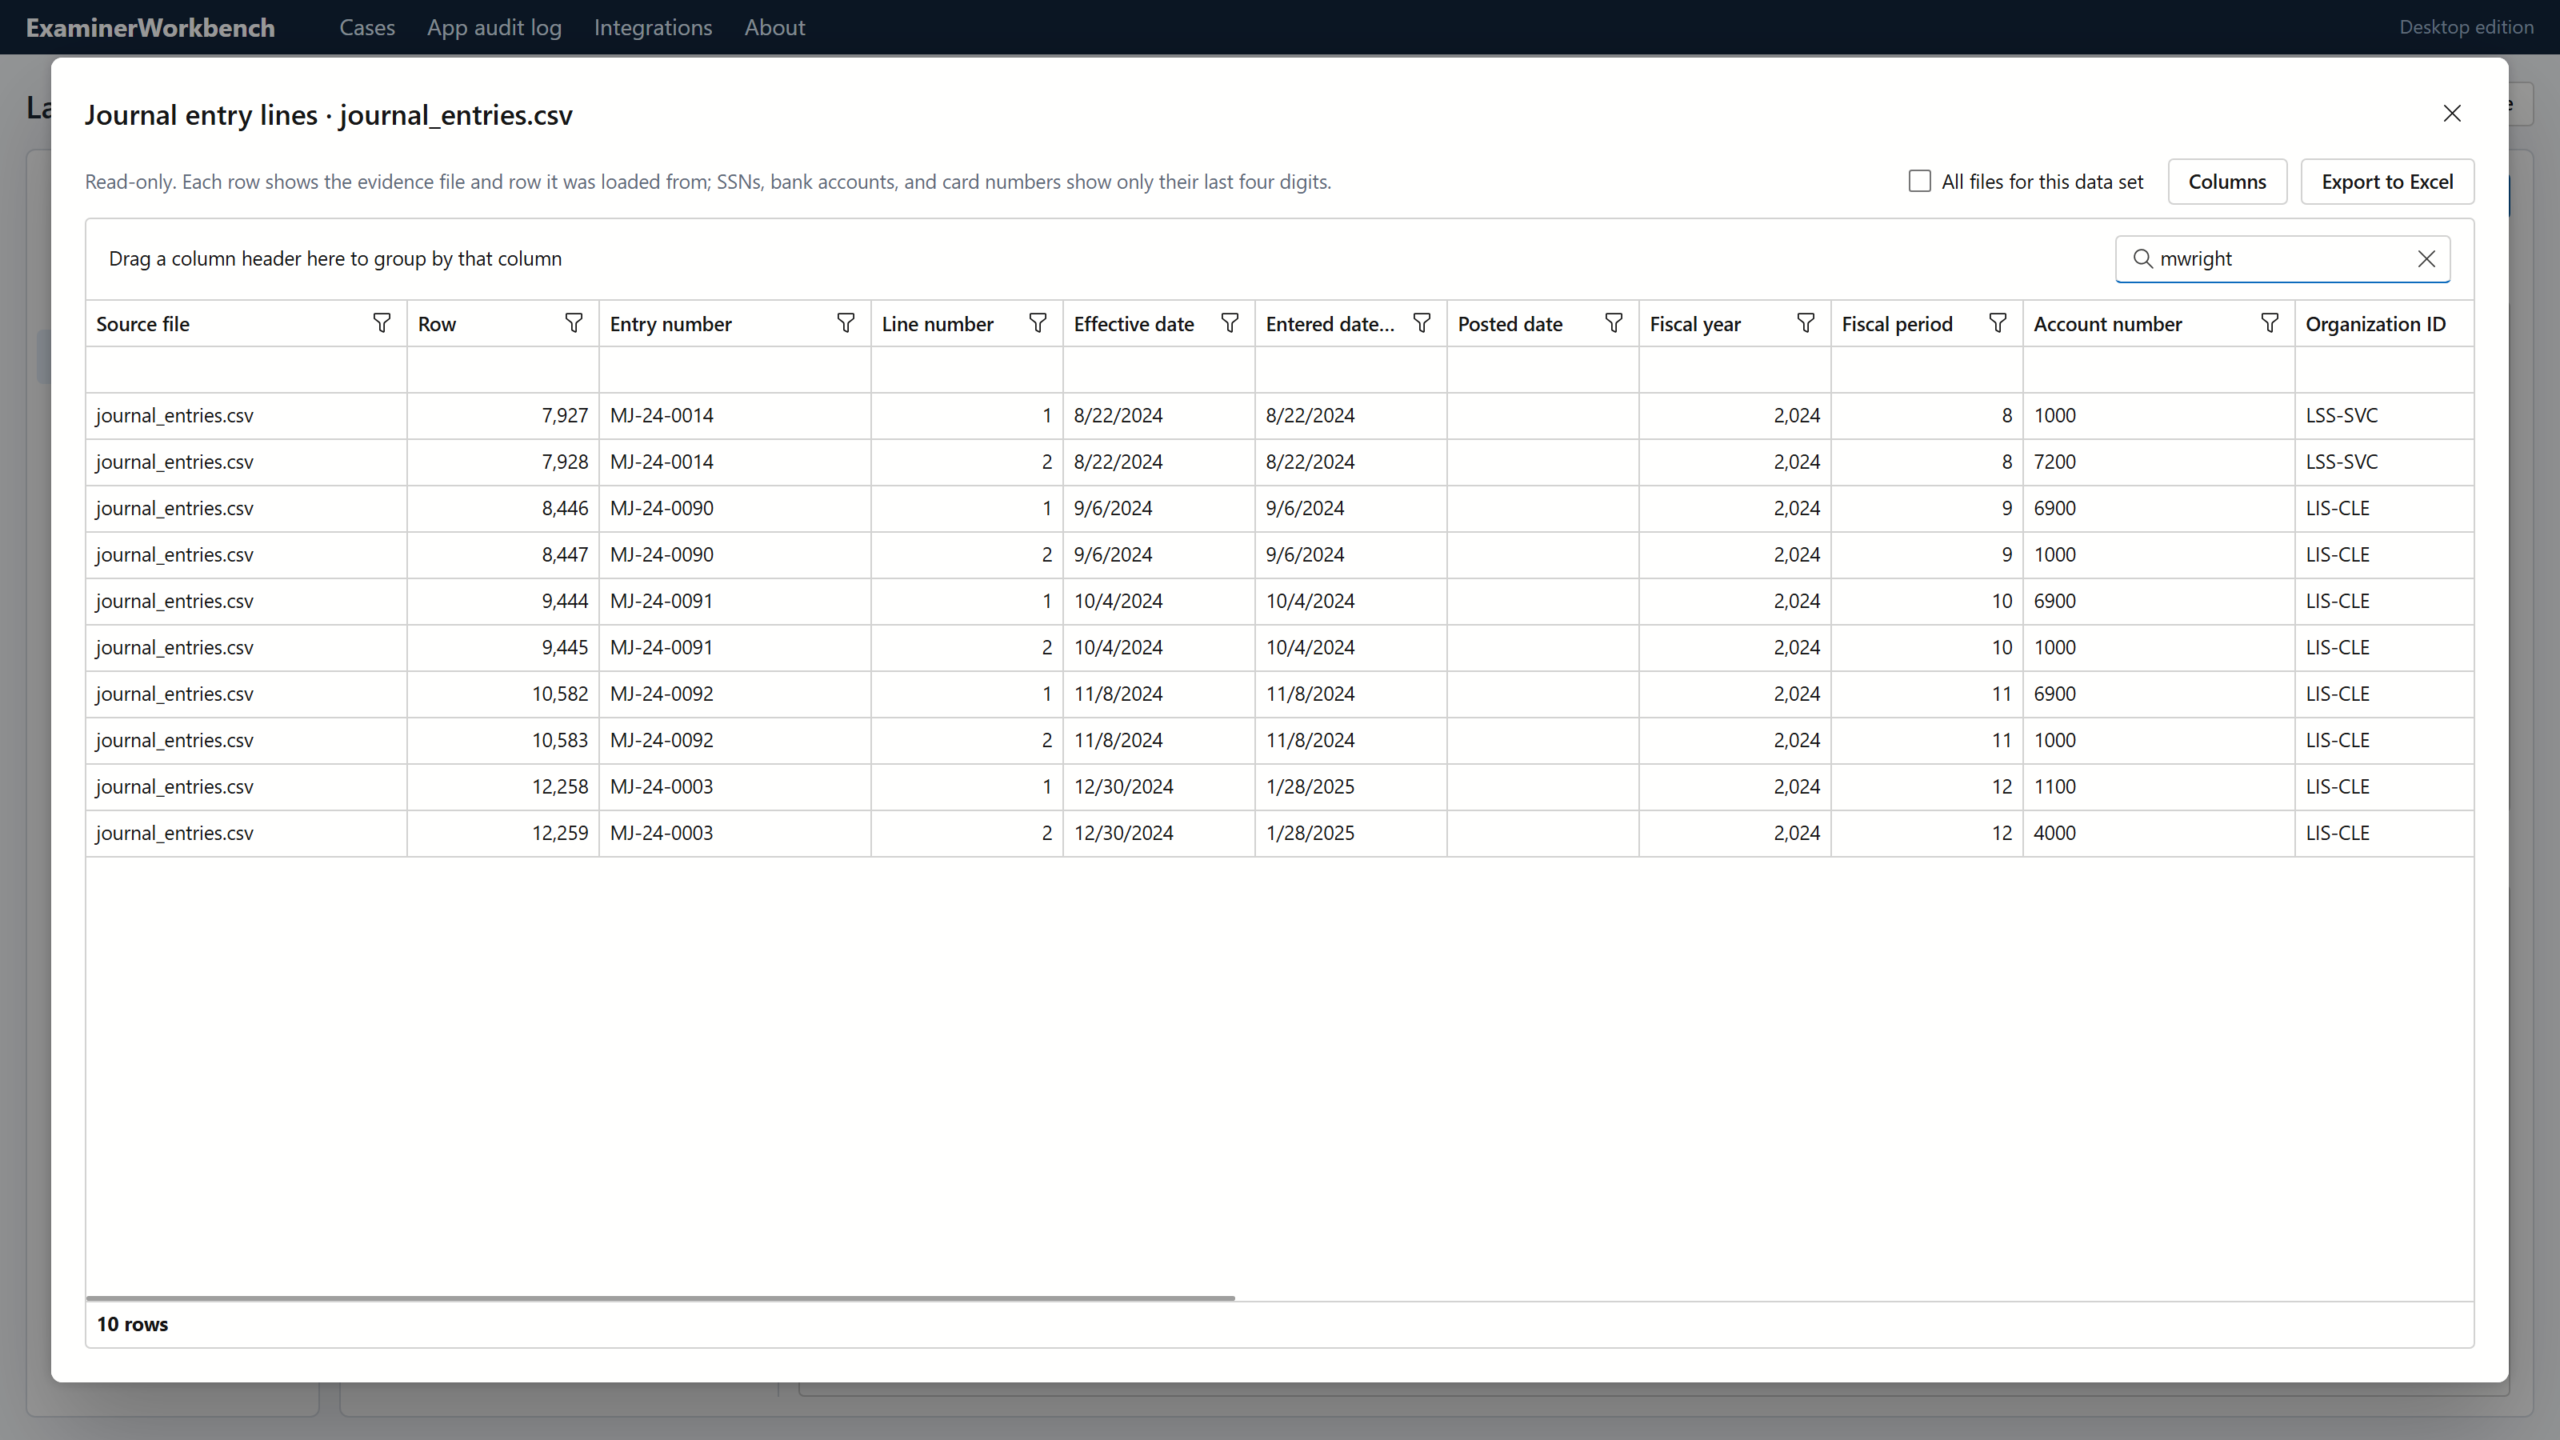
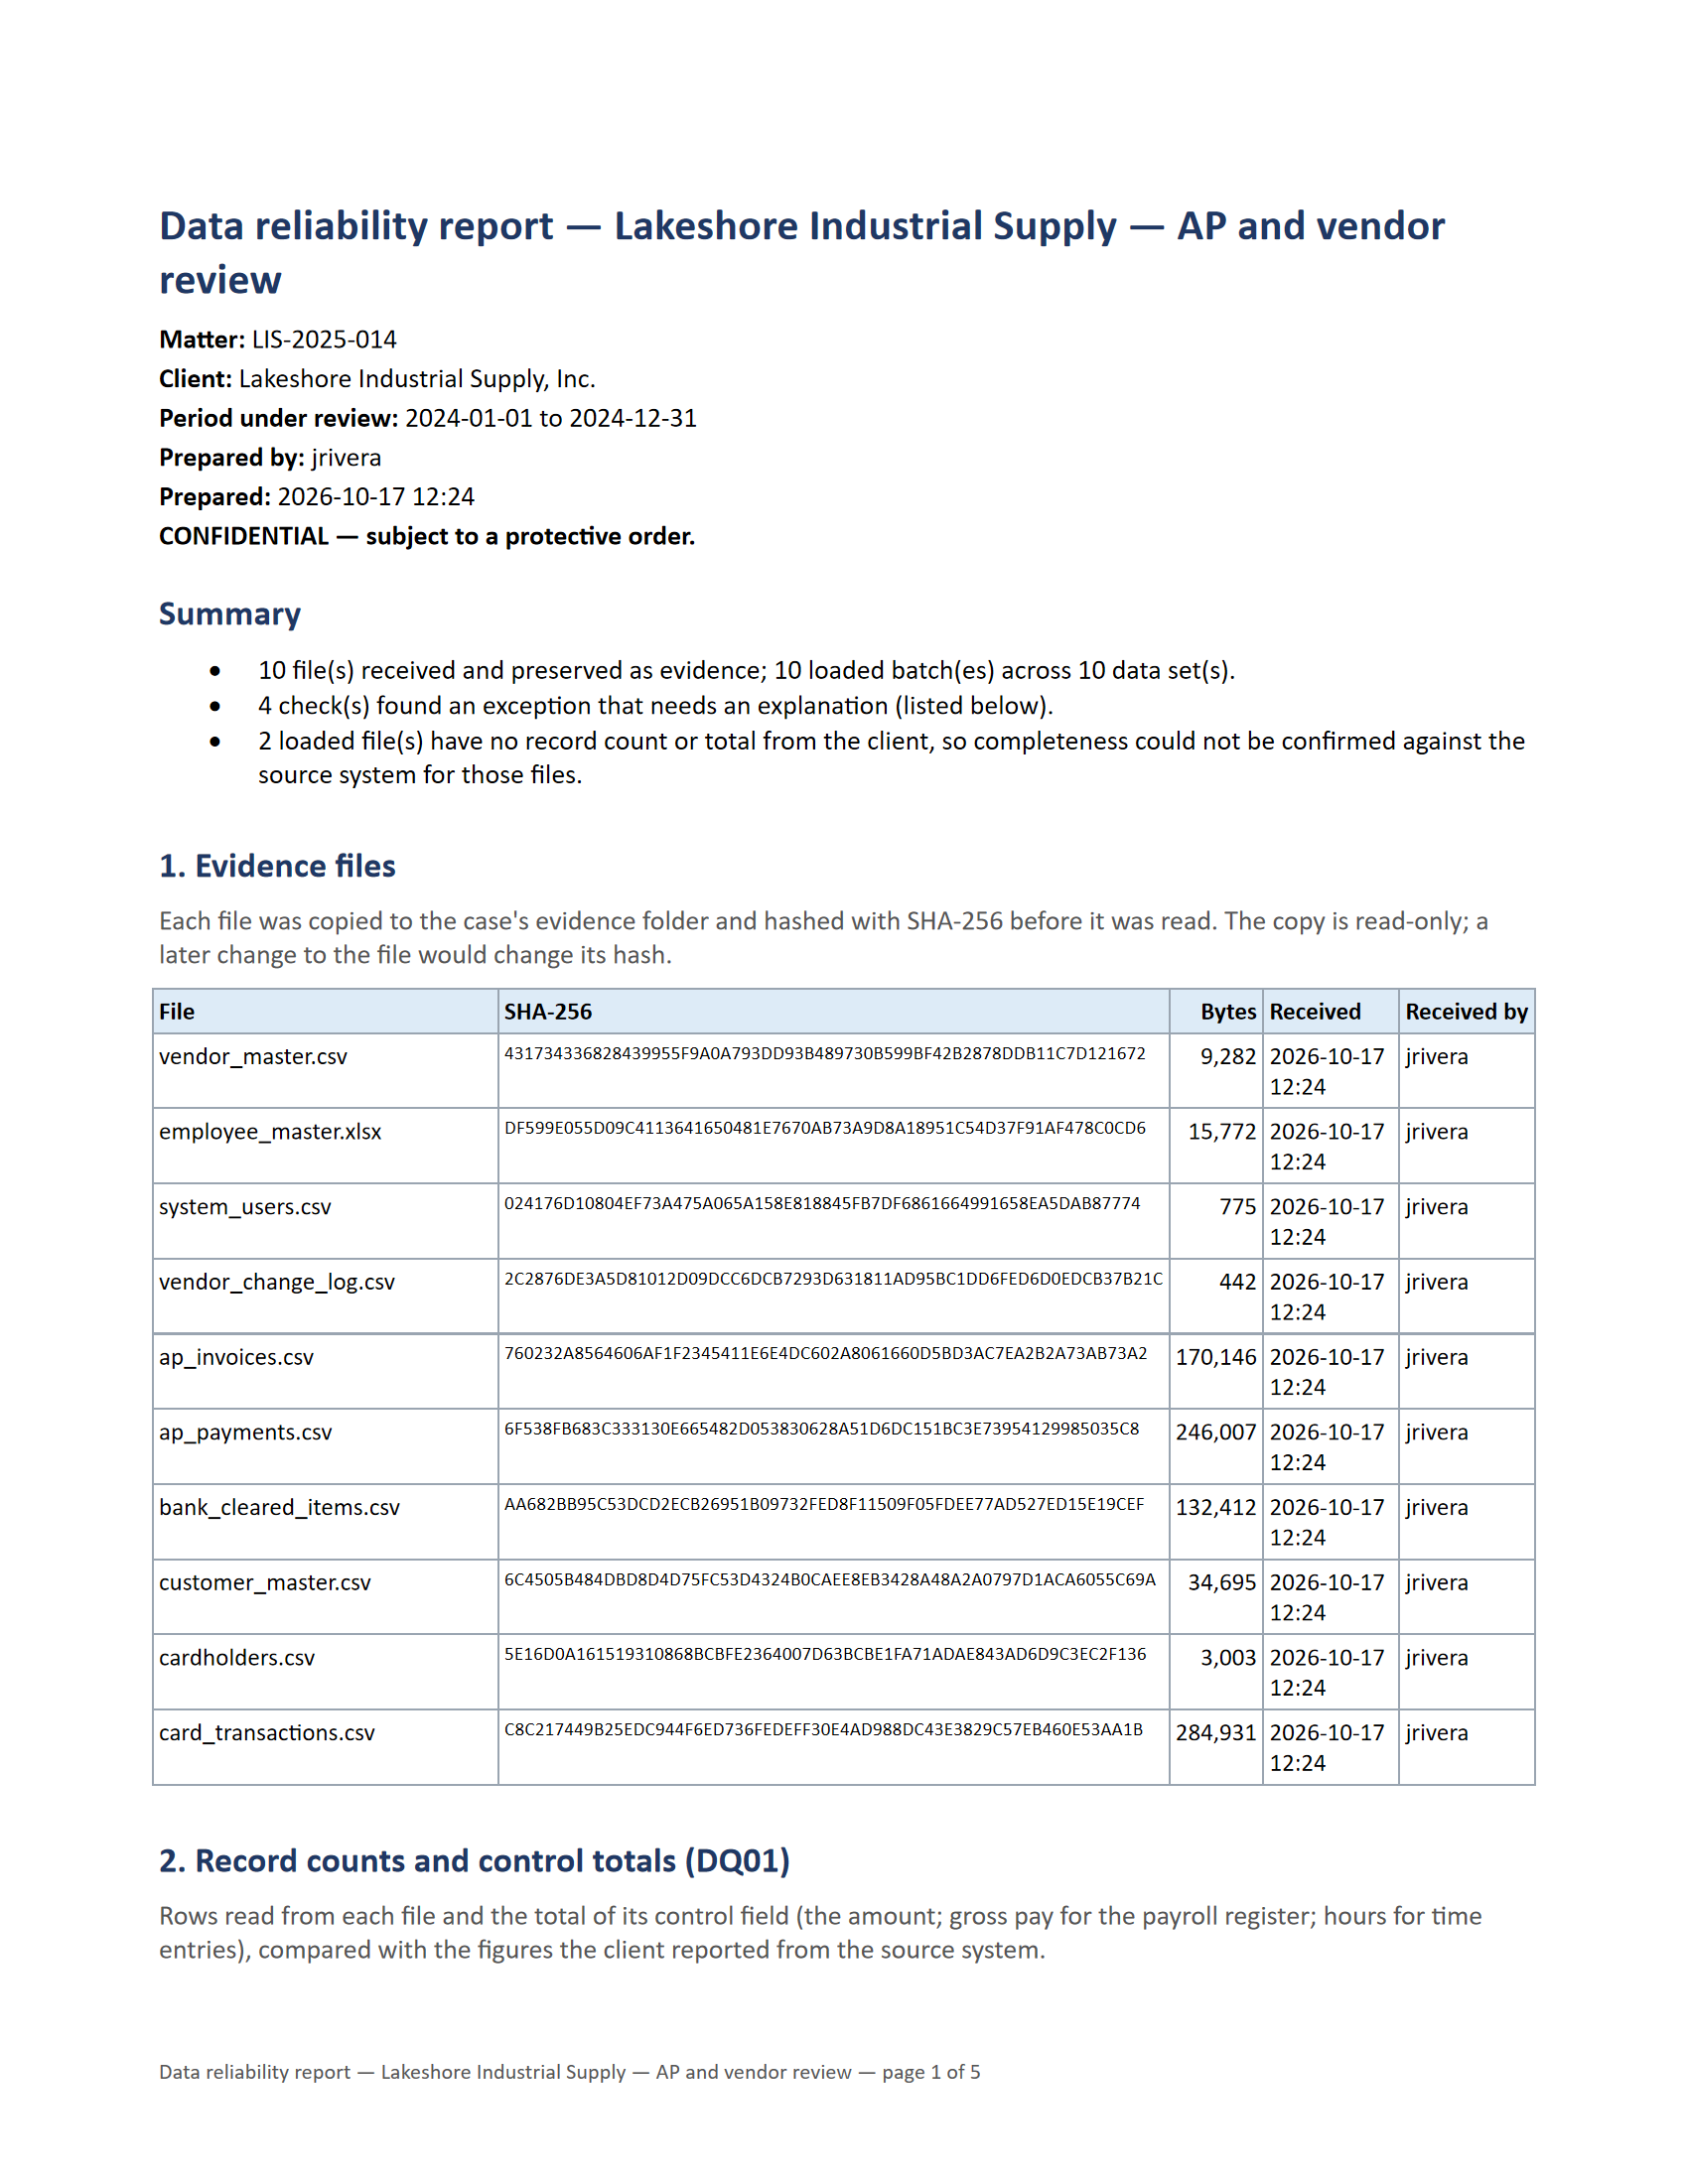
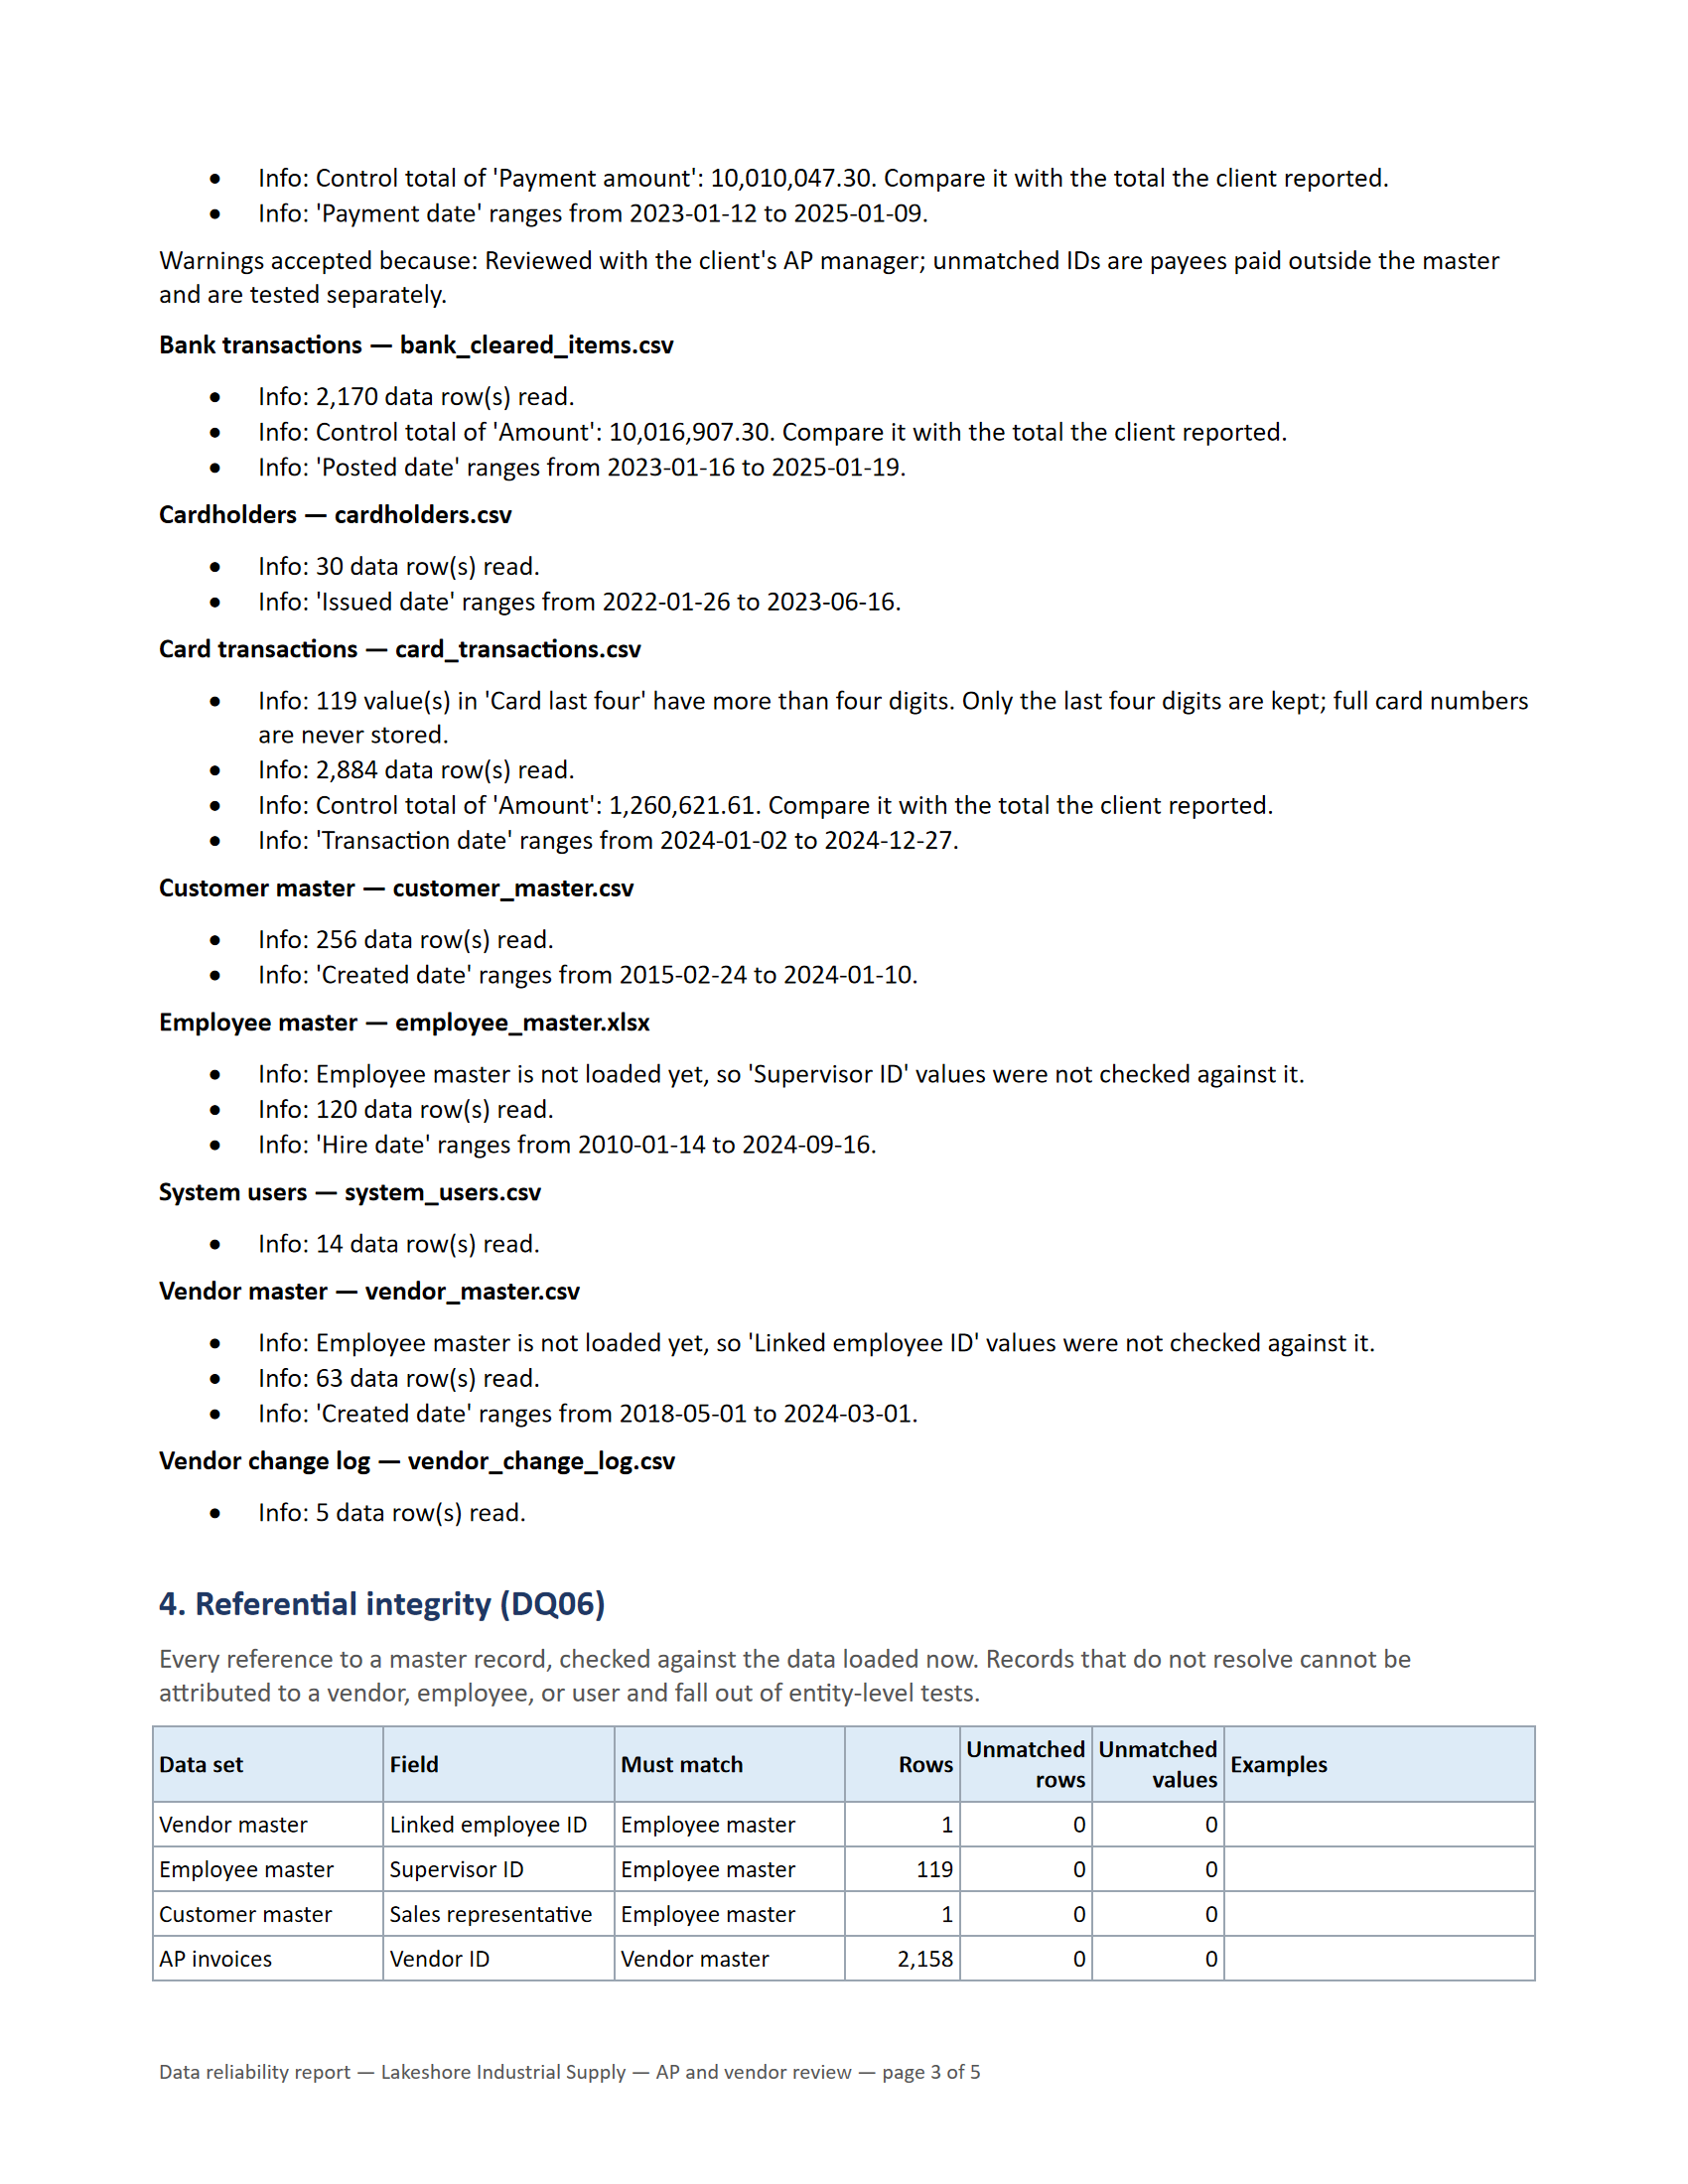
Files are hashed and preserved as received, then mapped to a common data model. Account classification is suggested automatically and confirmed by the examiner. Control totals and tie-outs run before any test, and every loaded row links back to its source file and row.
// Step 5
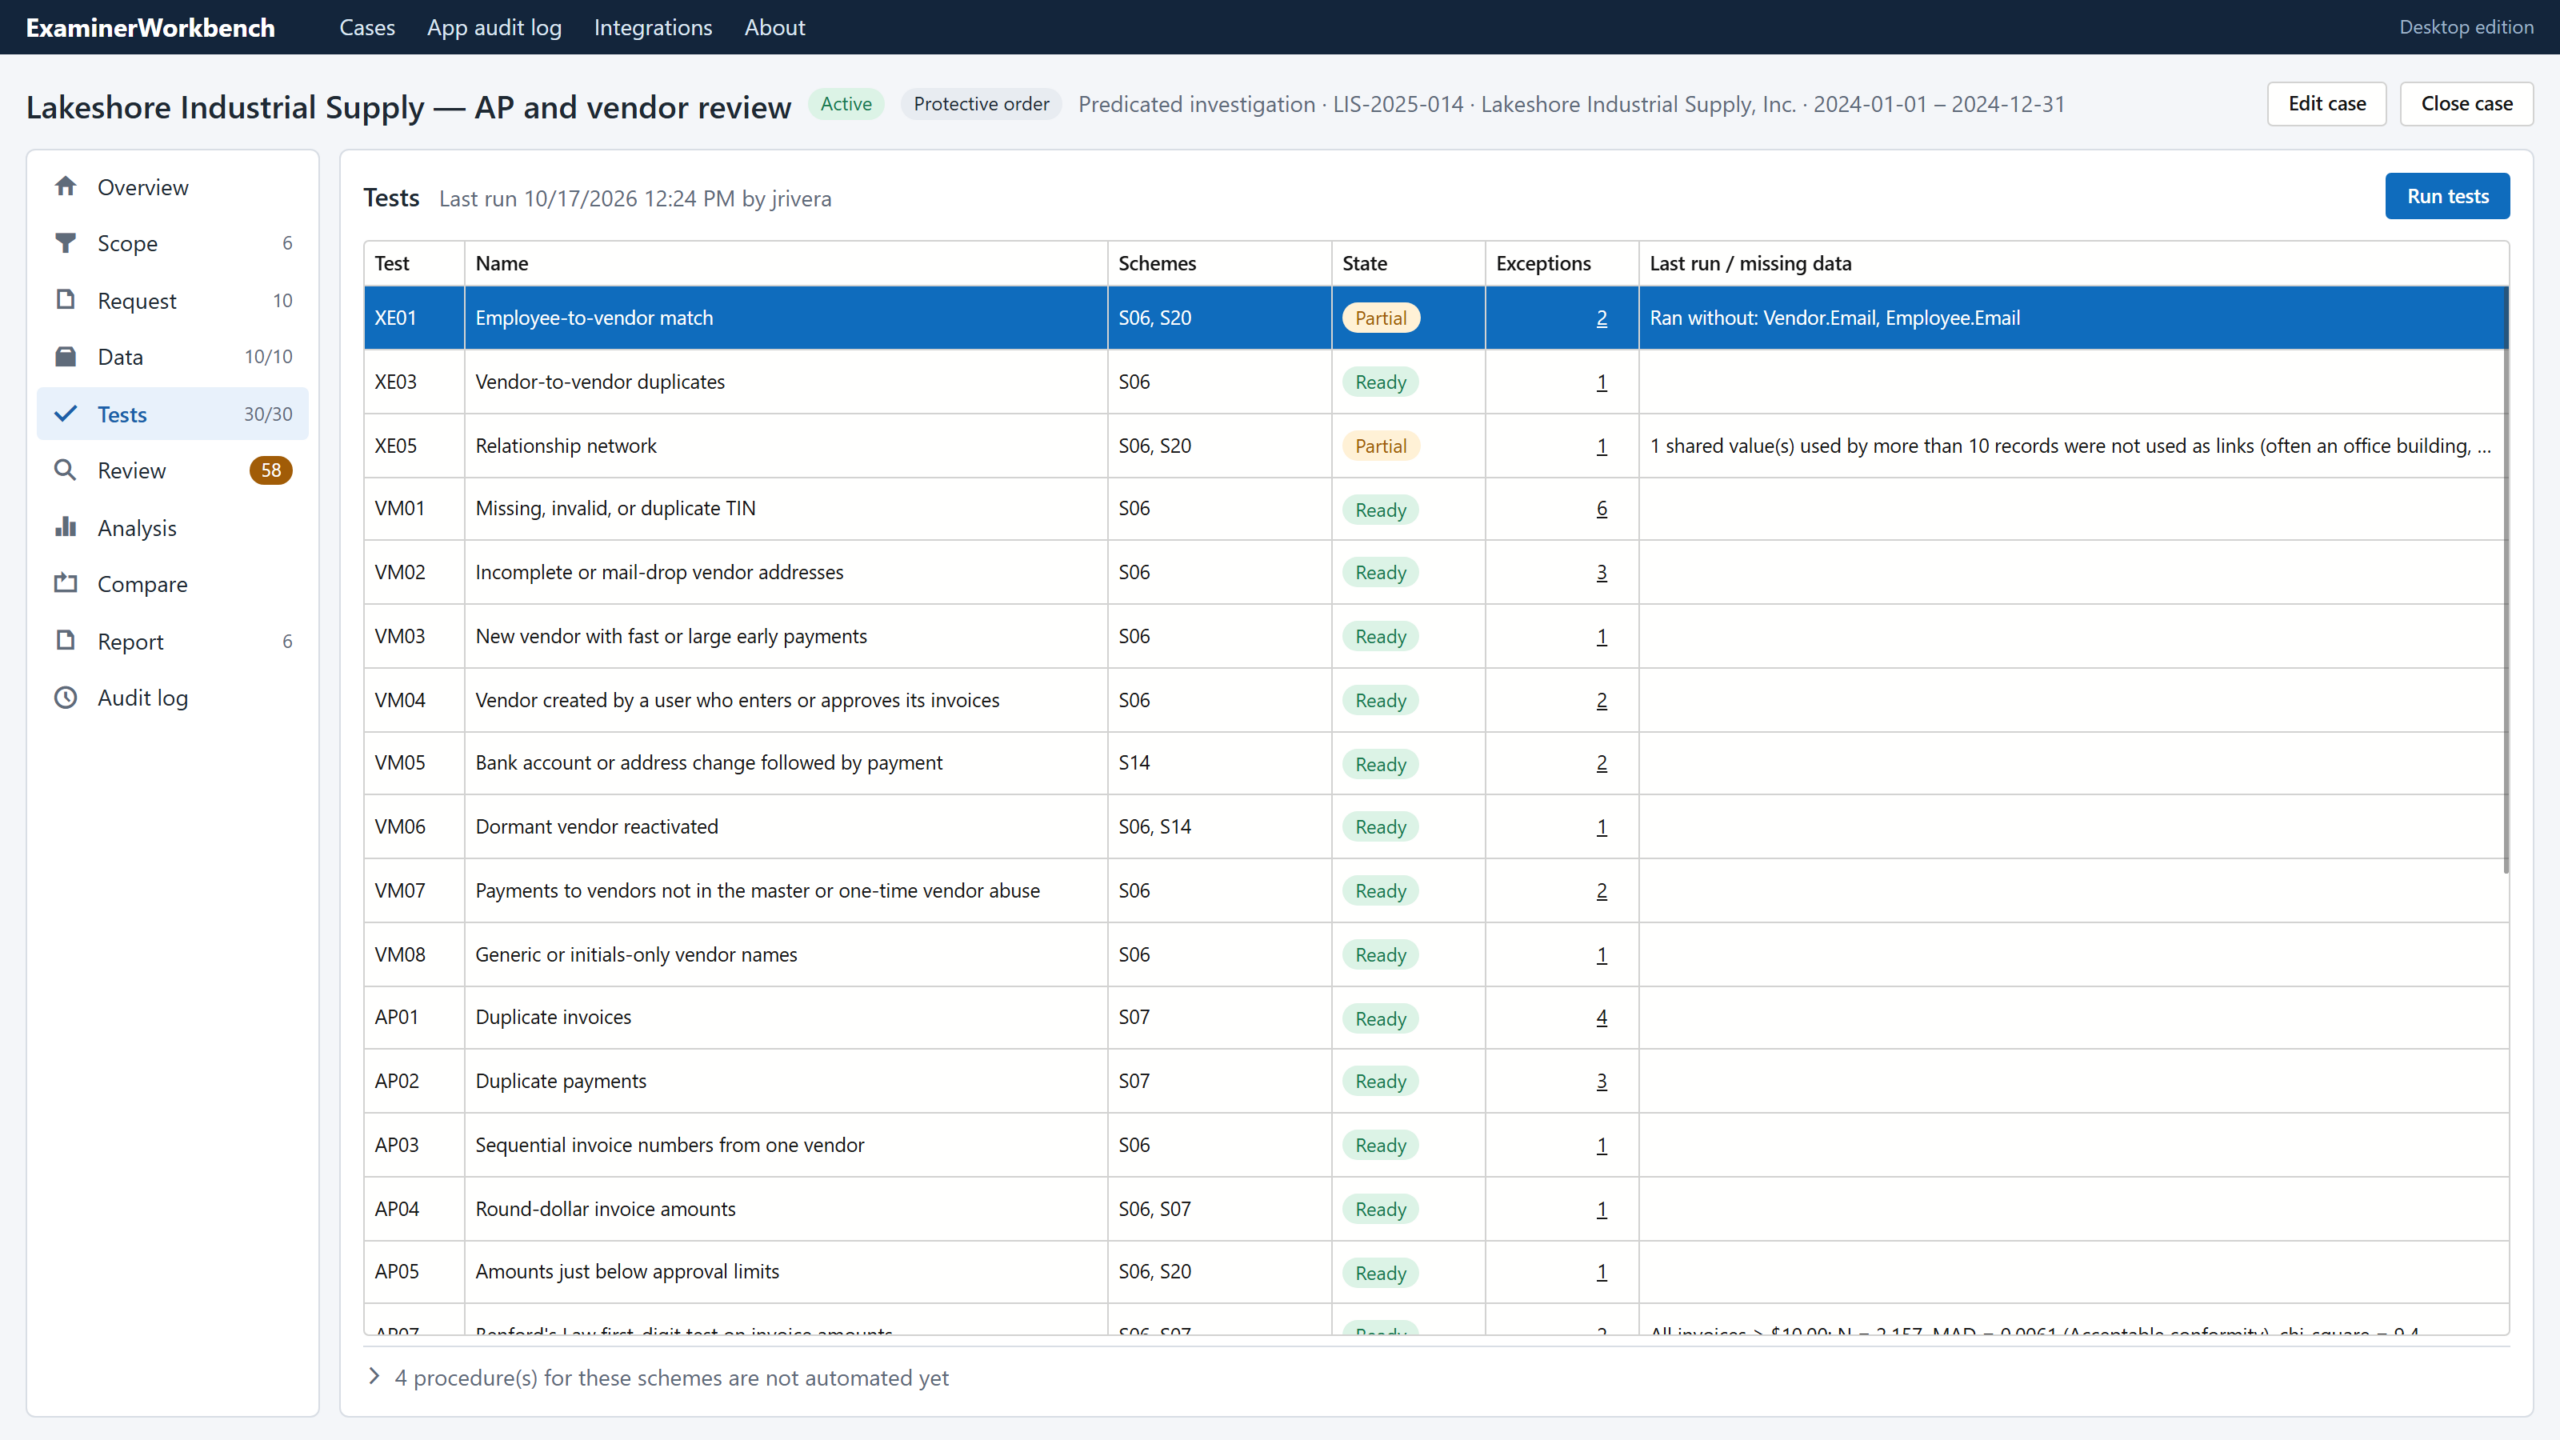
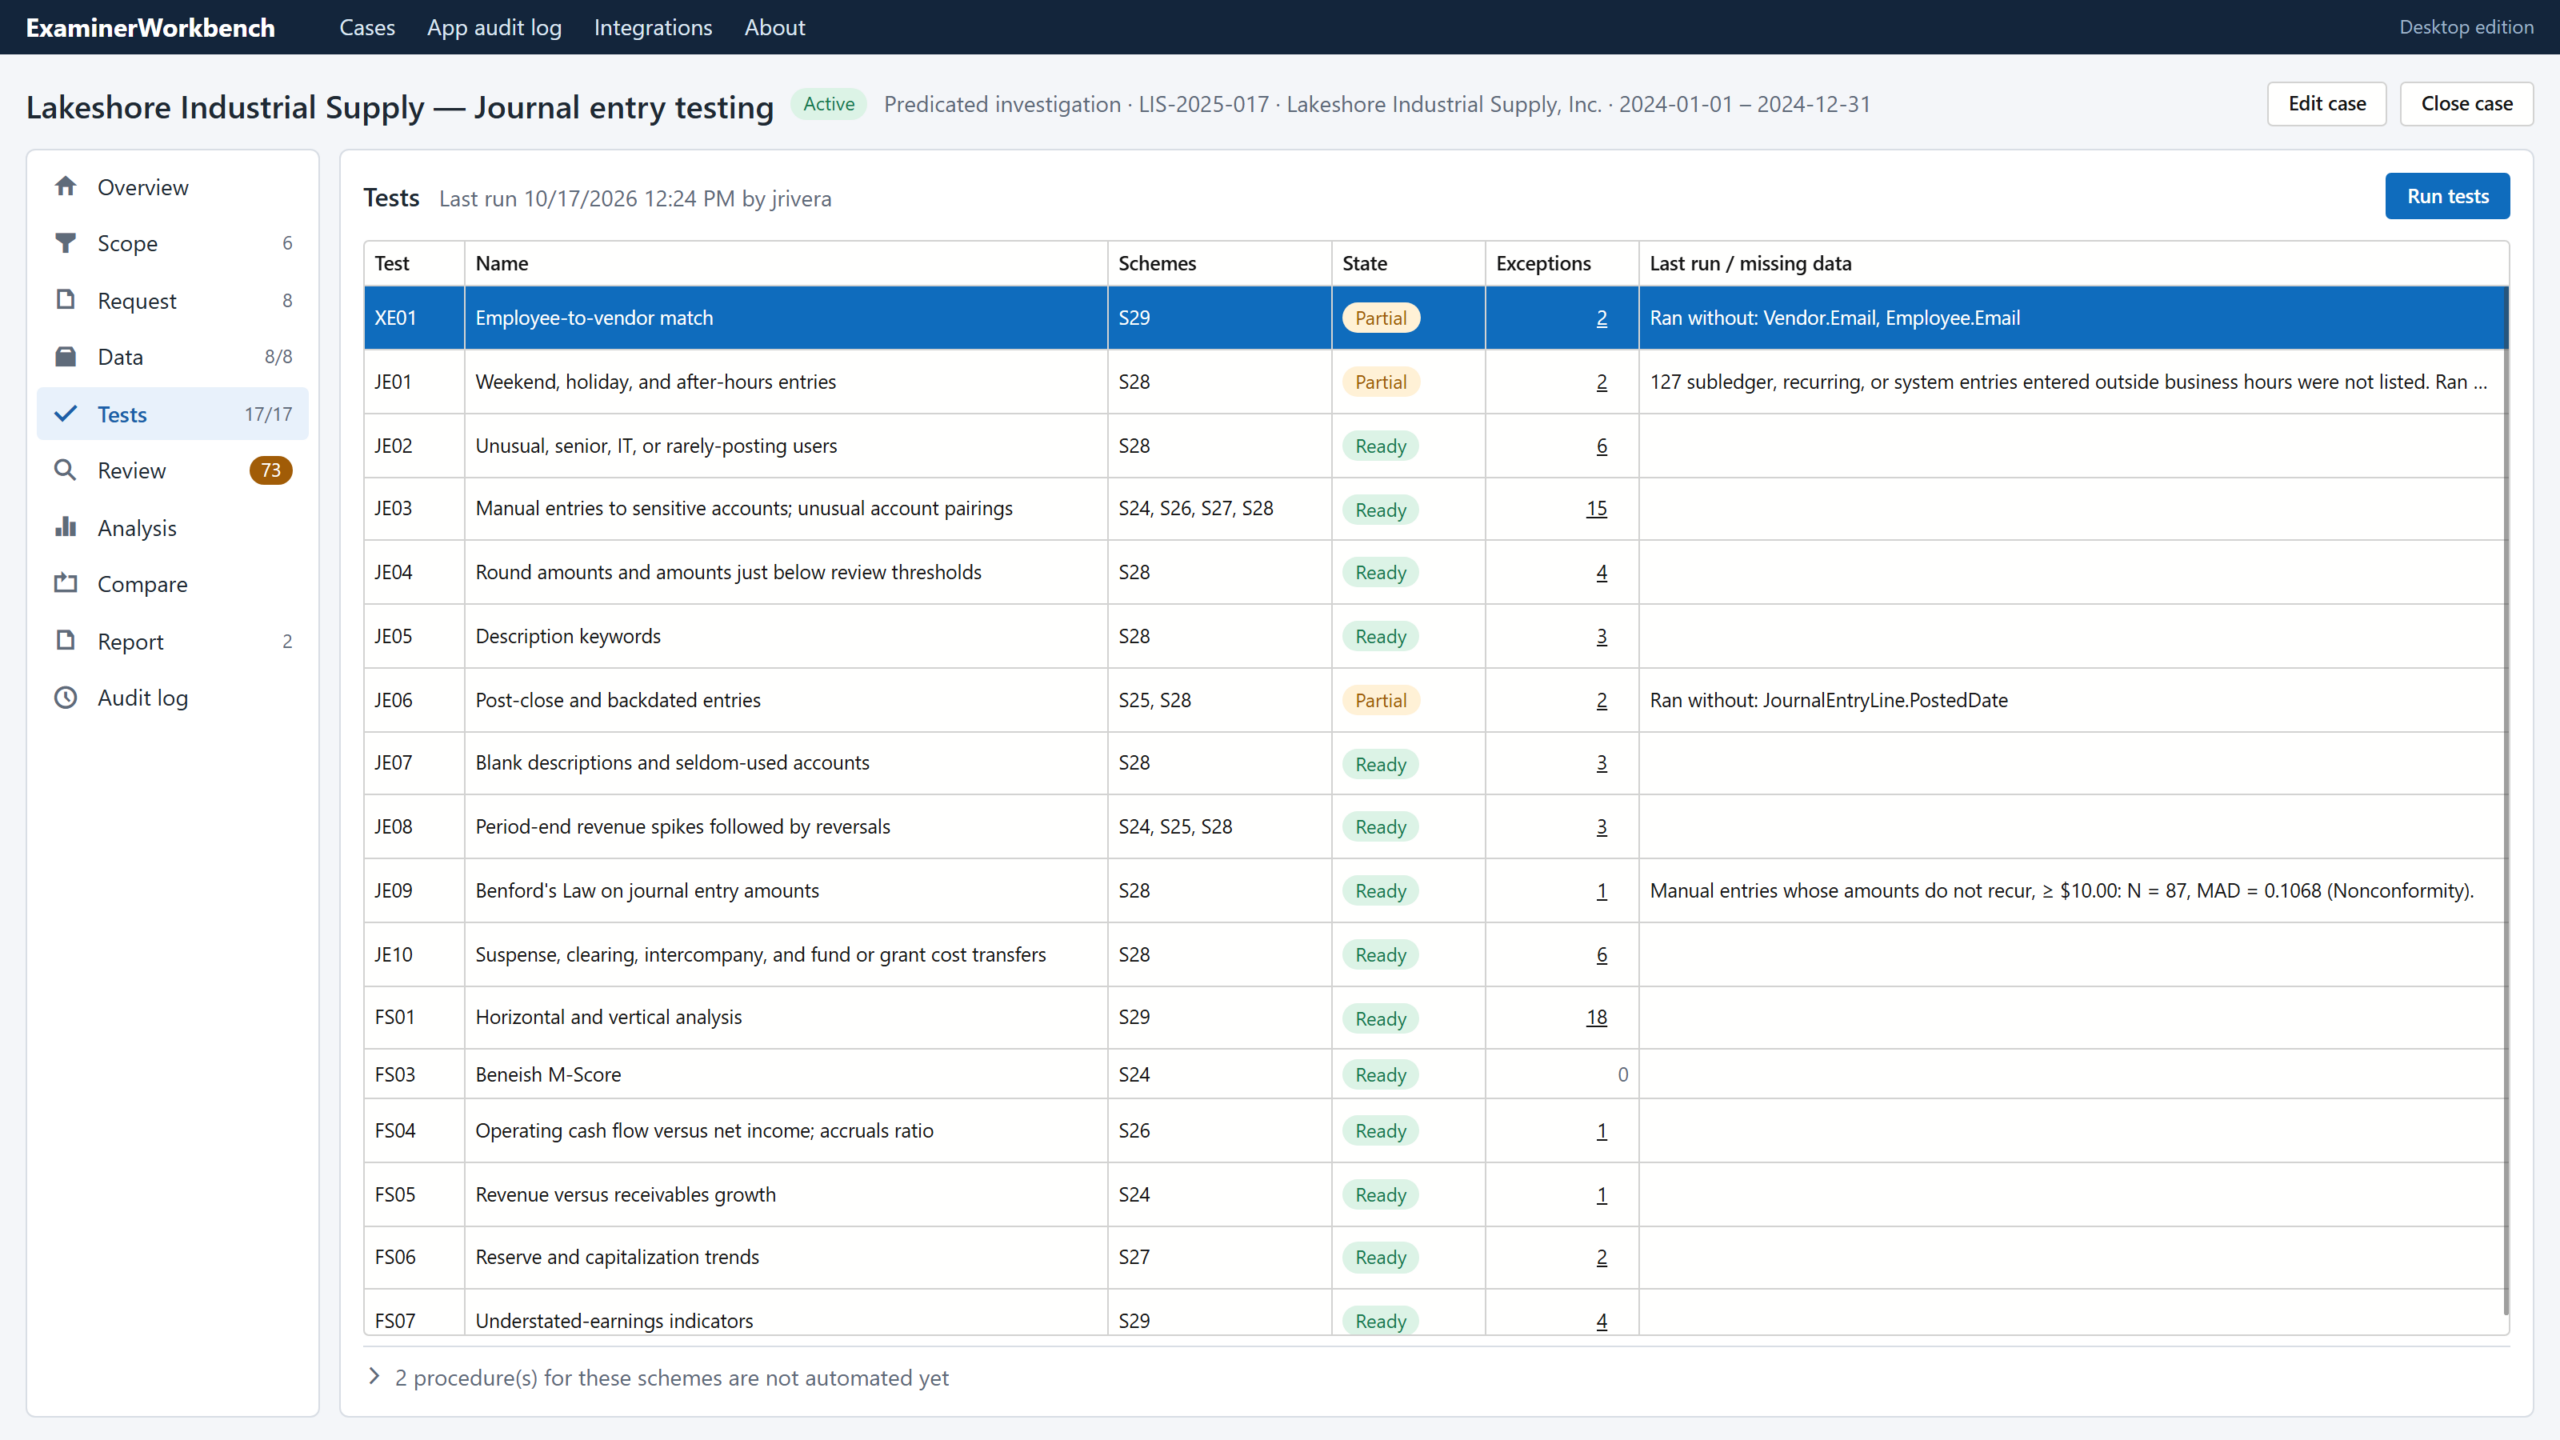
Every test is Ready, Partial or Blocked.
Run 60+ automated tests across payroll, expense reimbursement, purchasing cards, journal entries, financial statements and data reliability. Readiness is shown per test from the data actually loaded, and each run records the application version, test versions, parameters and input file hashes so it can be reproduced.
// Step 6
Resolve every exception, and say why.
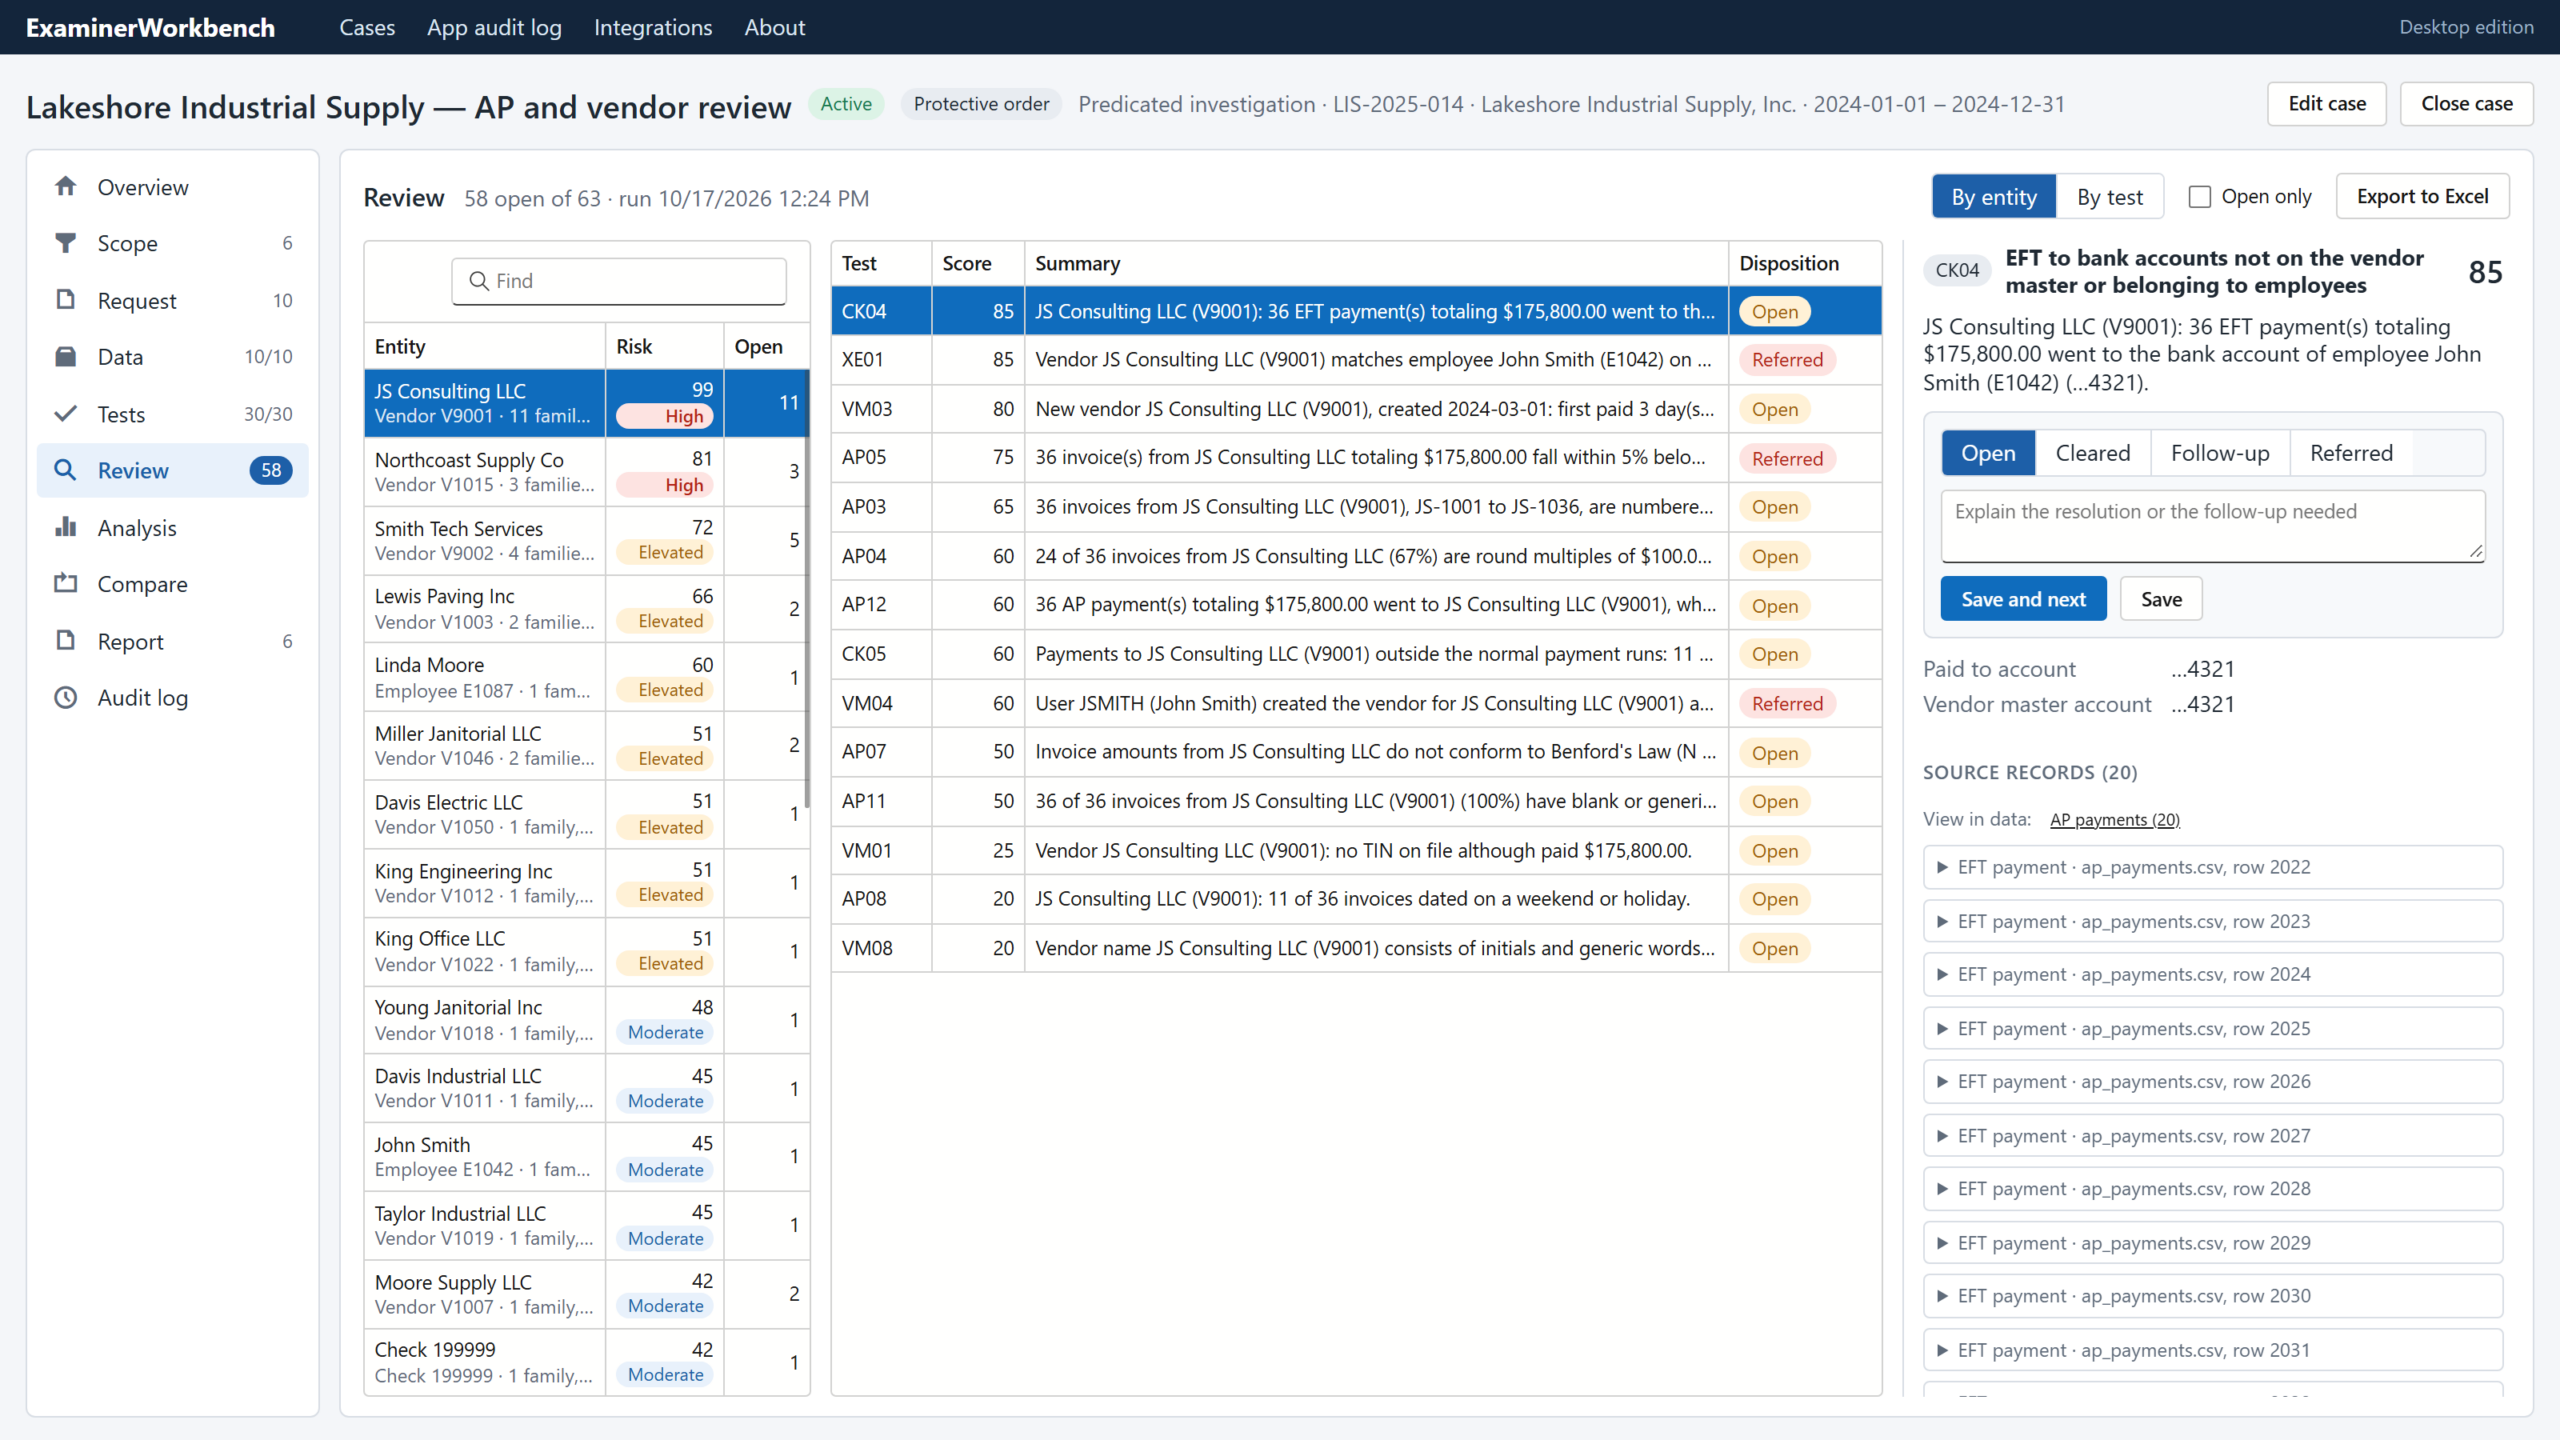
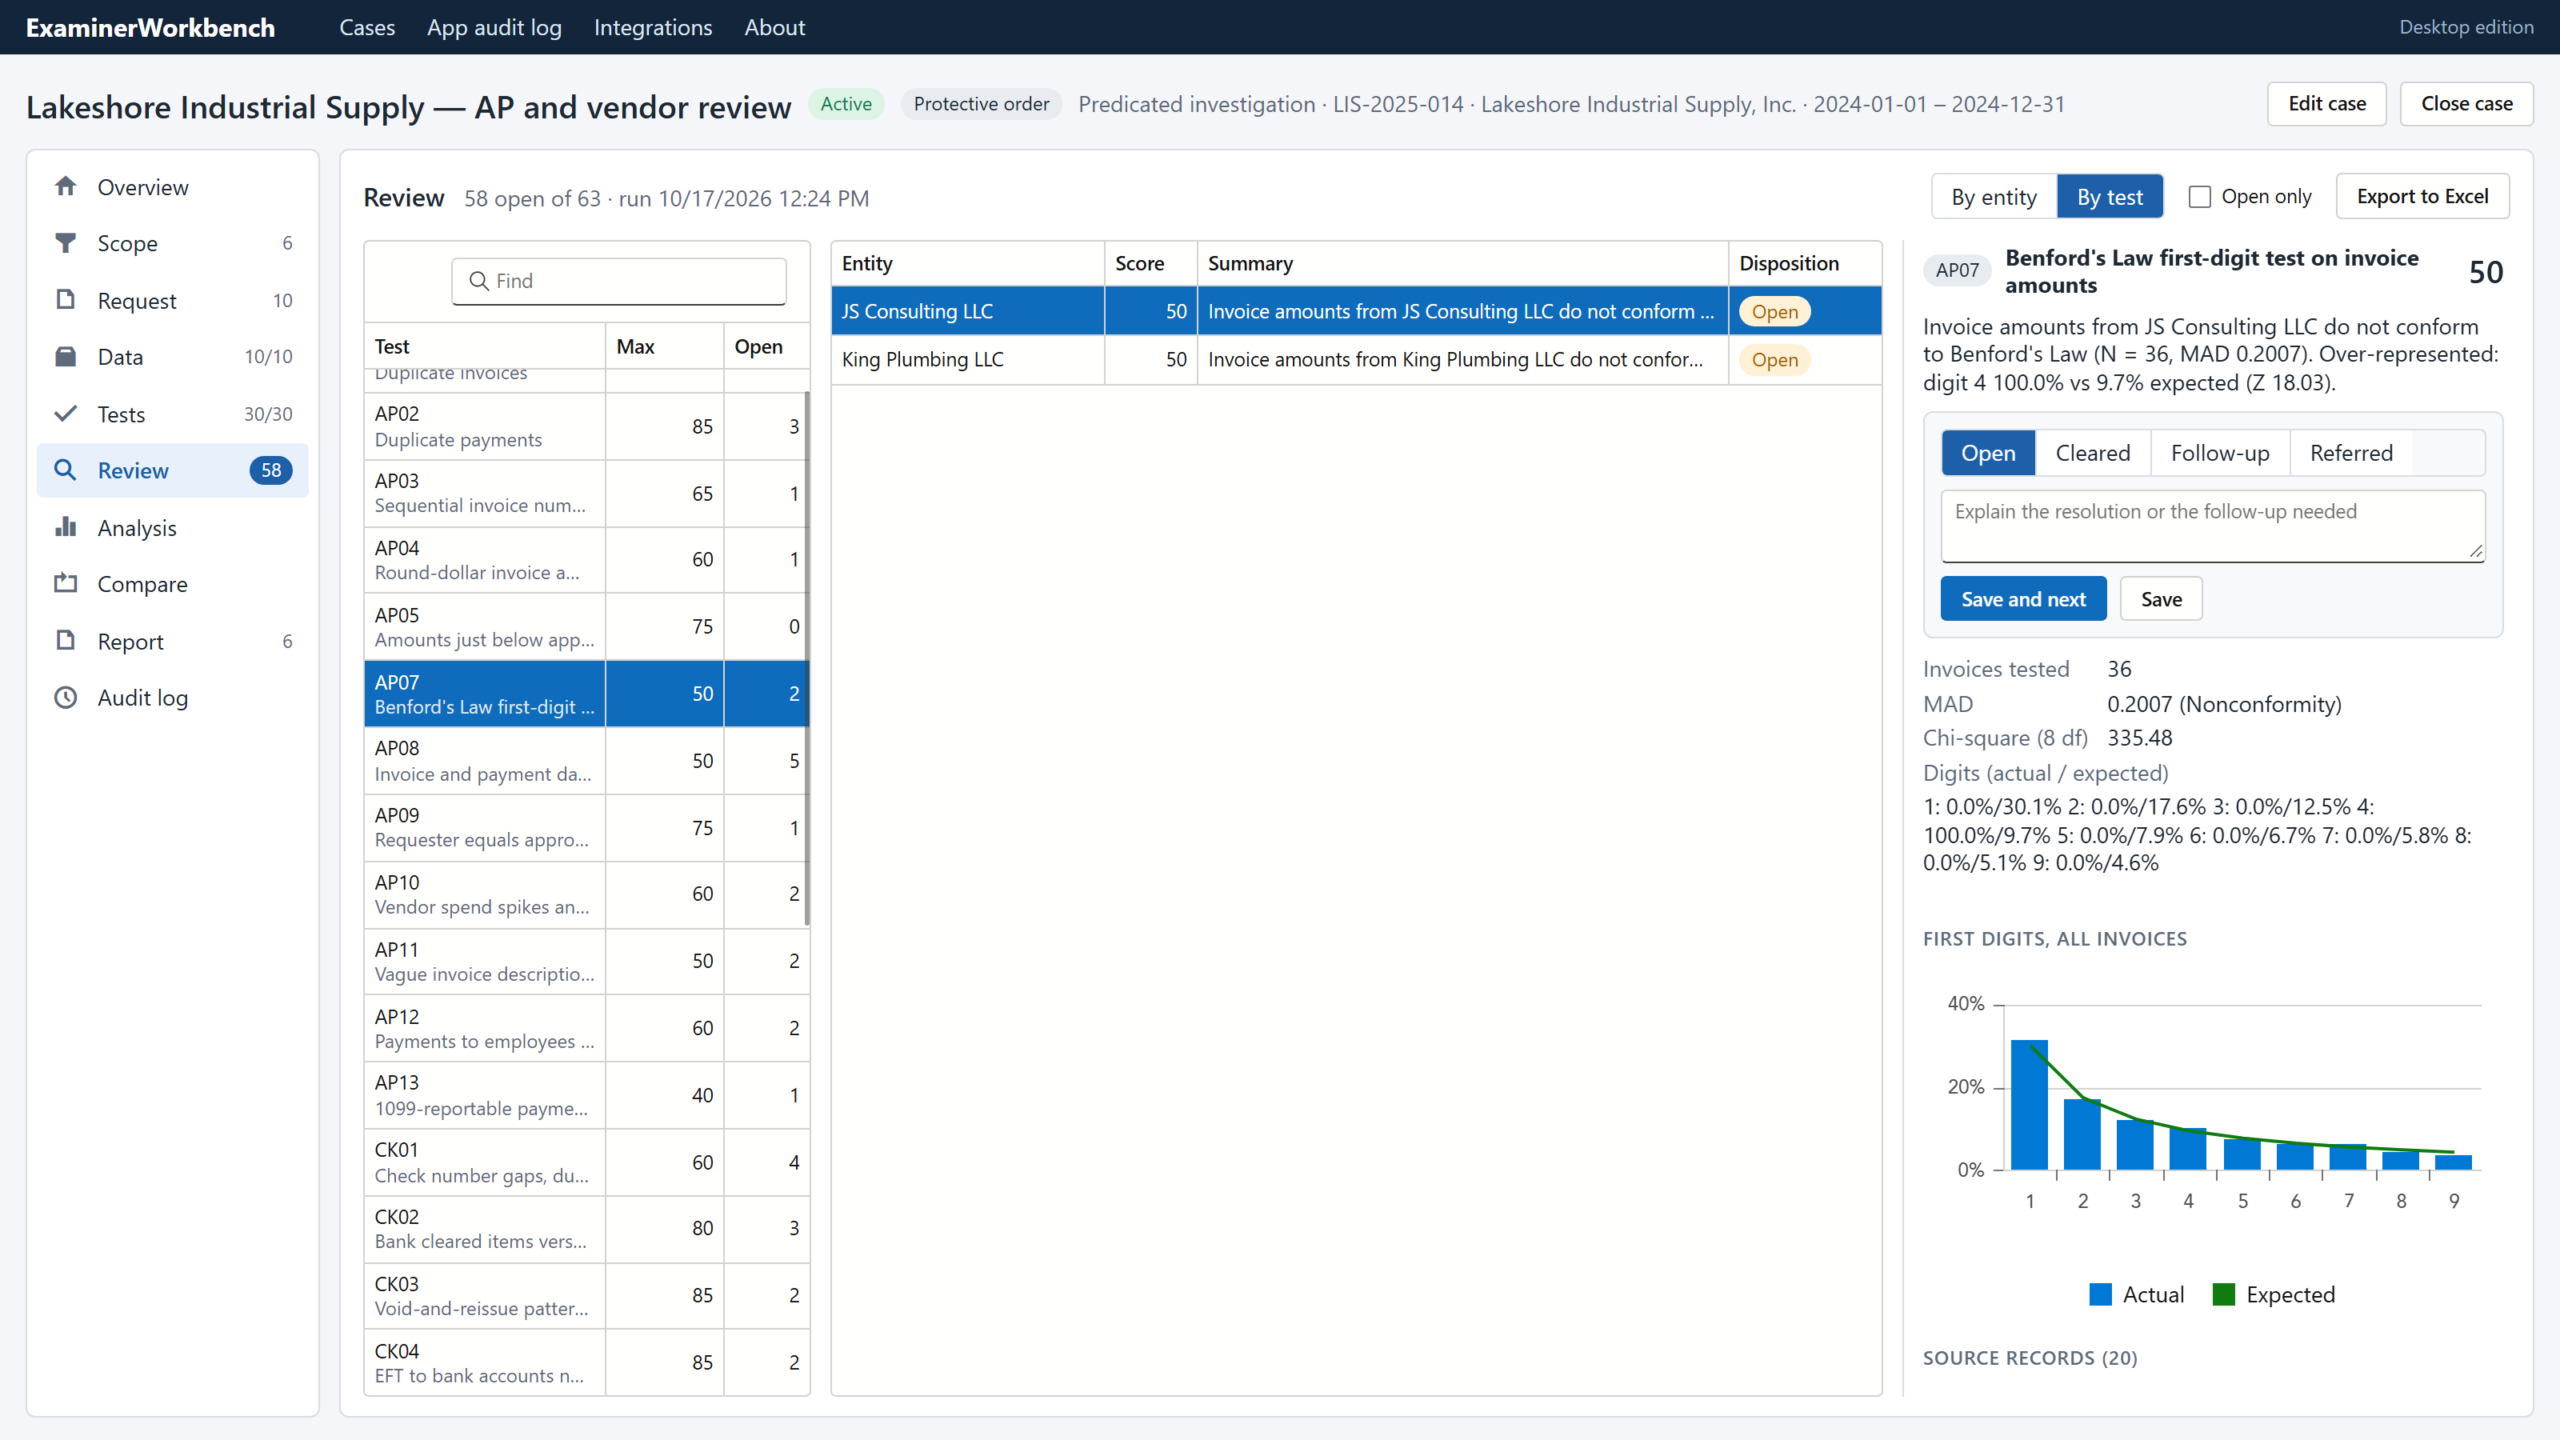
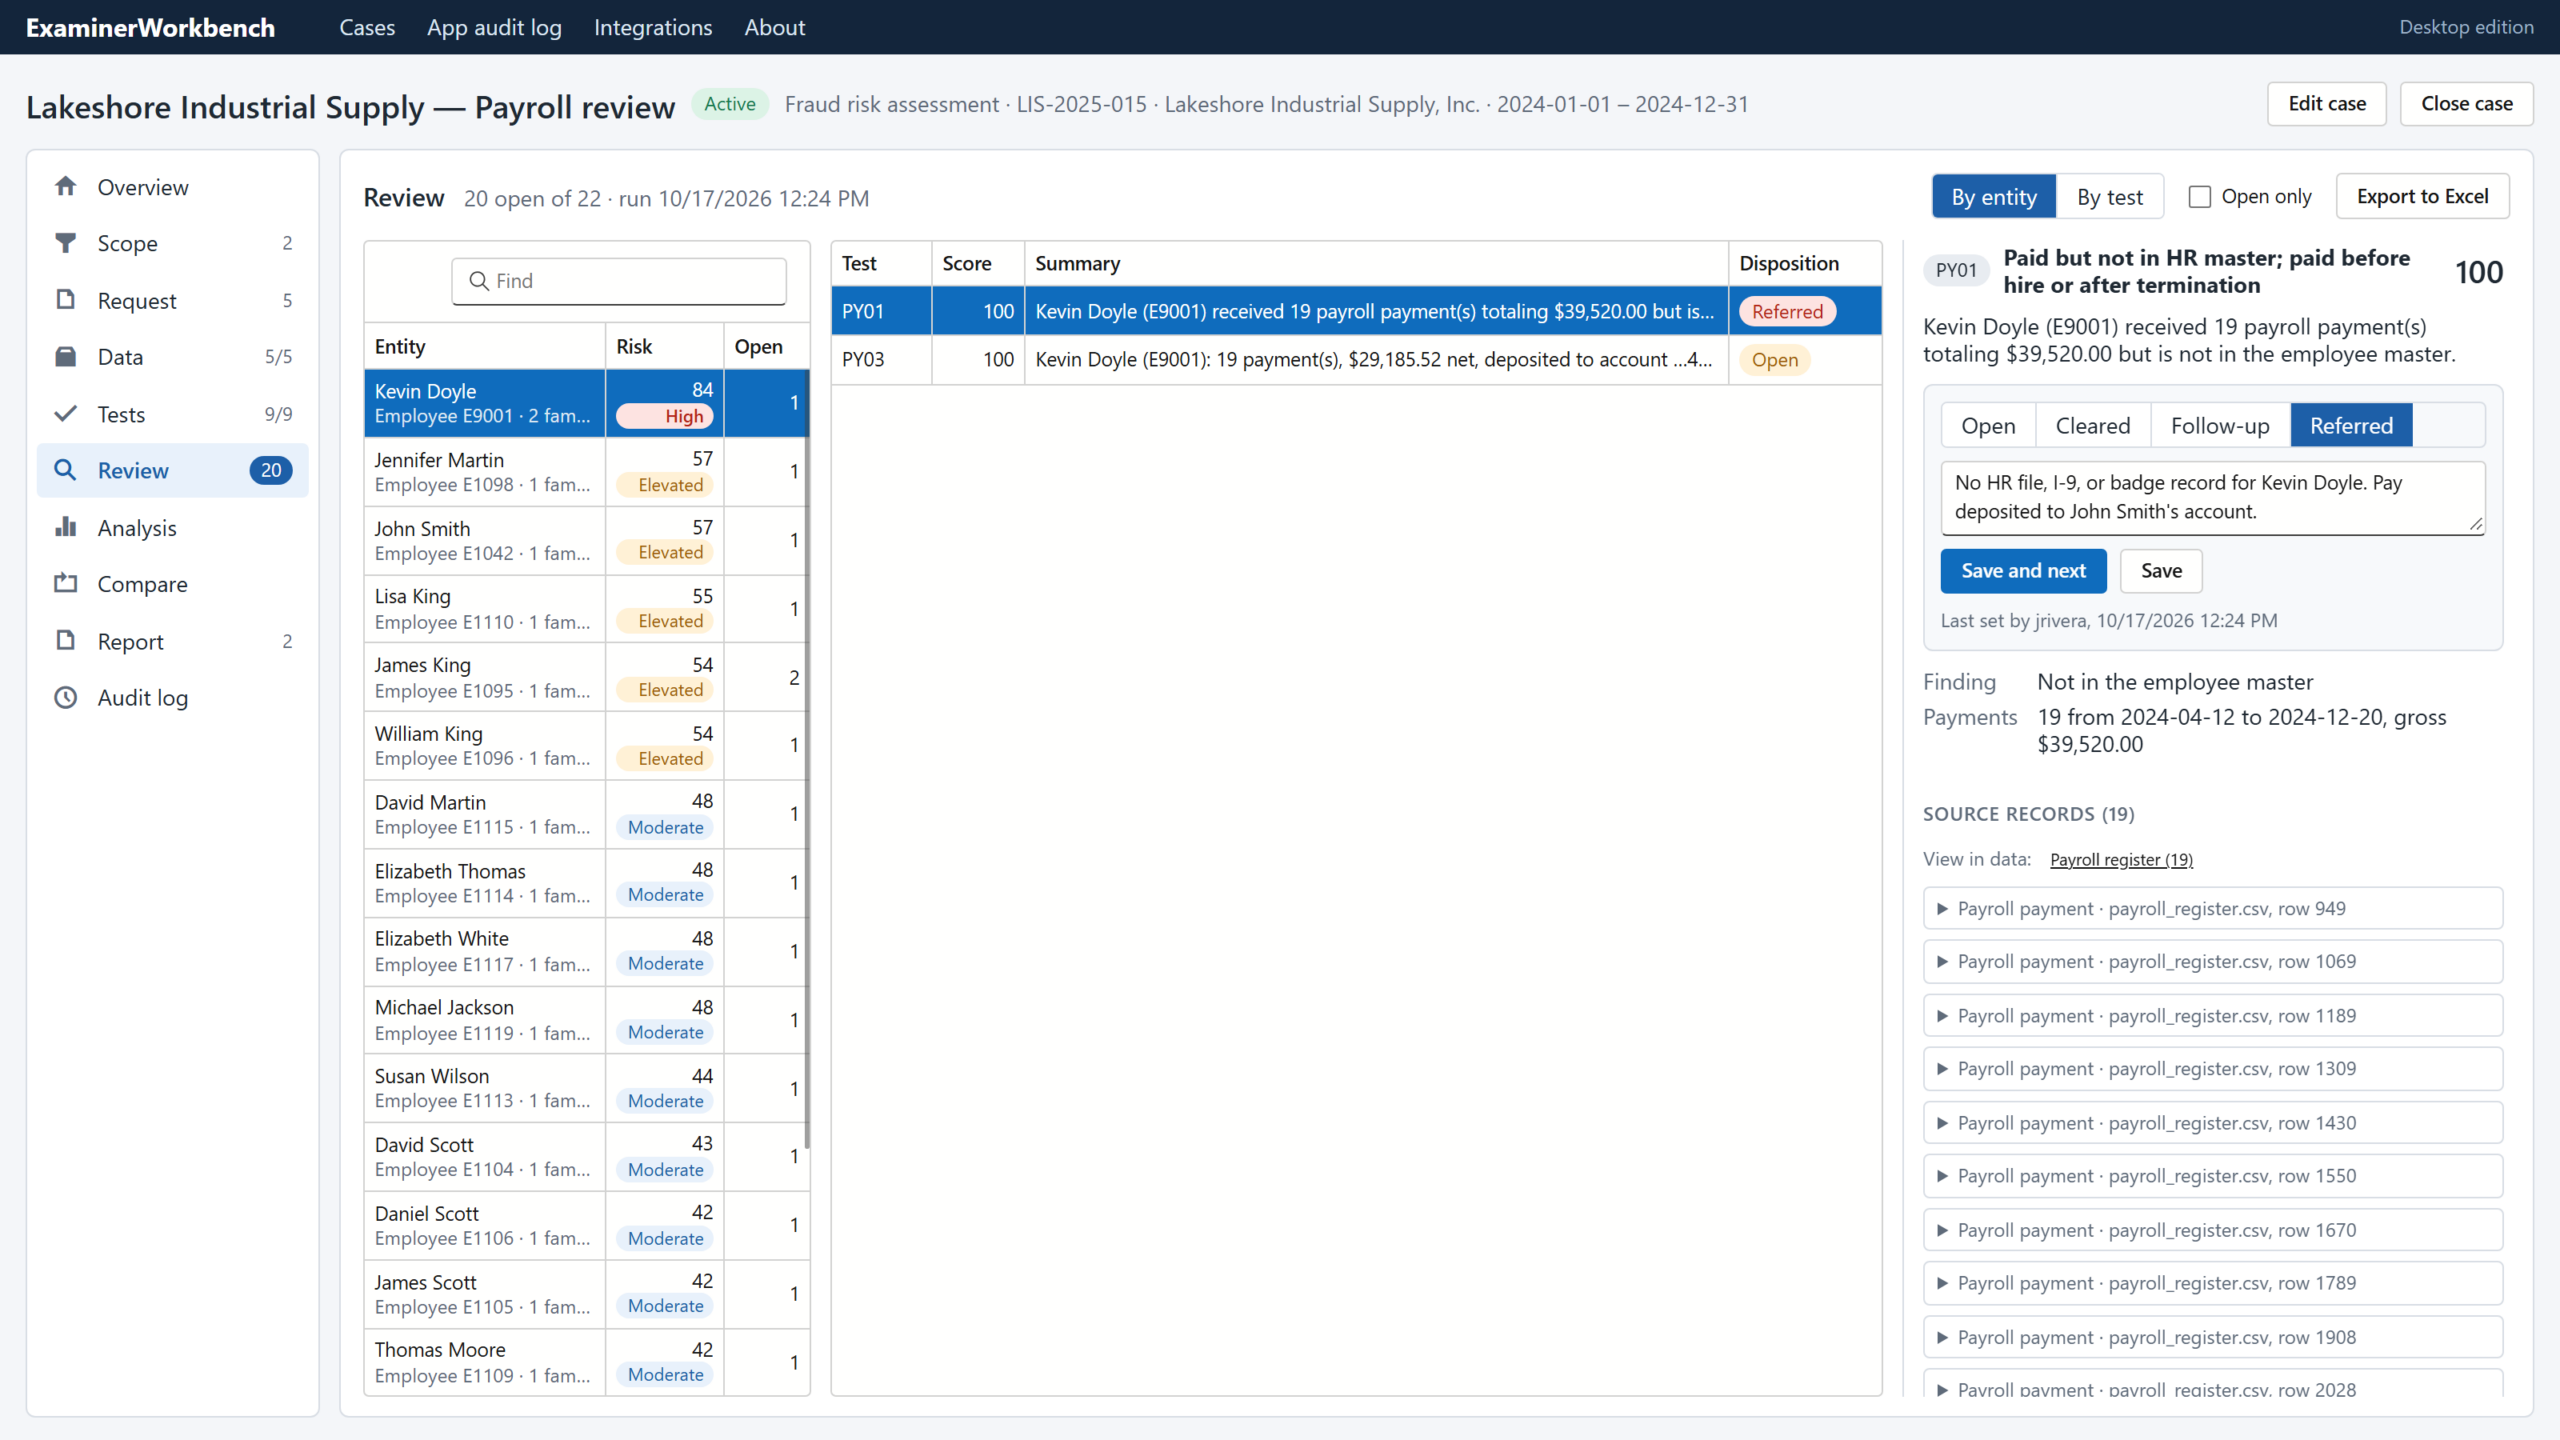
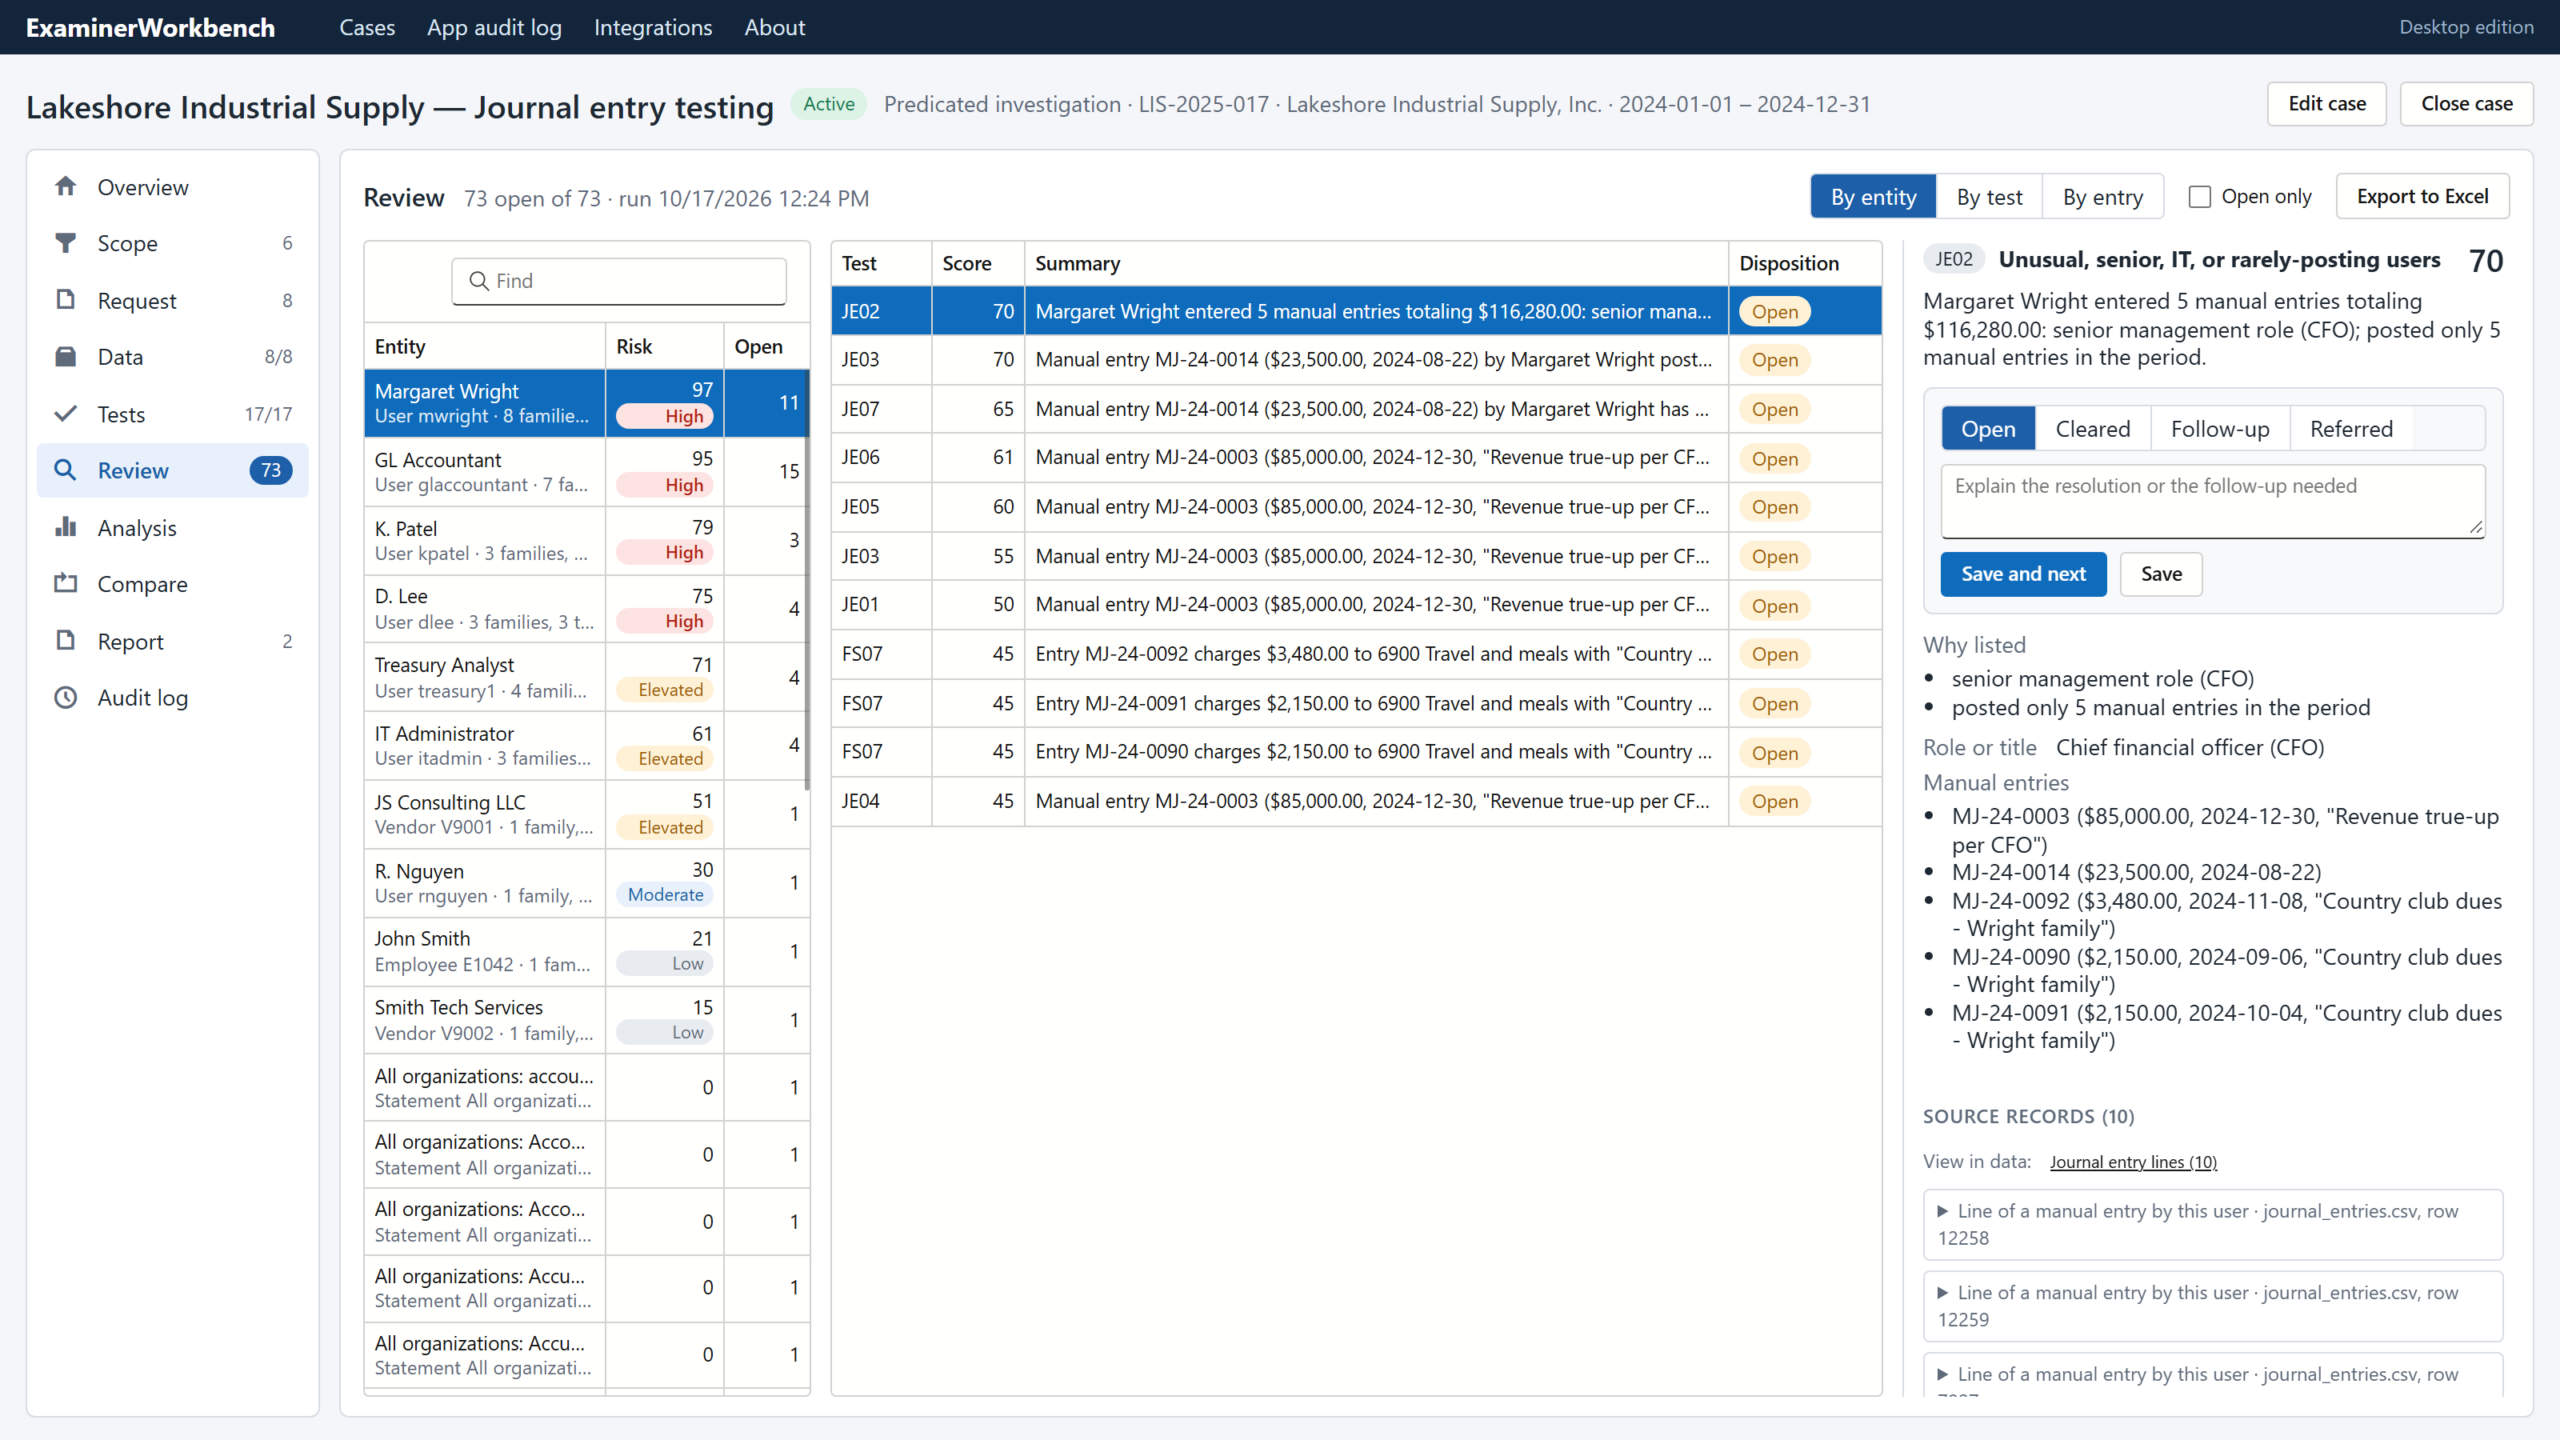
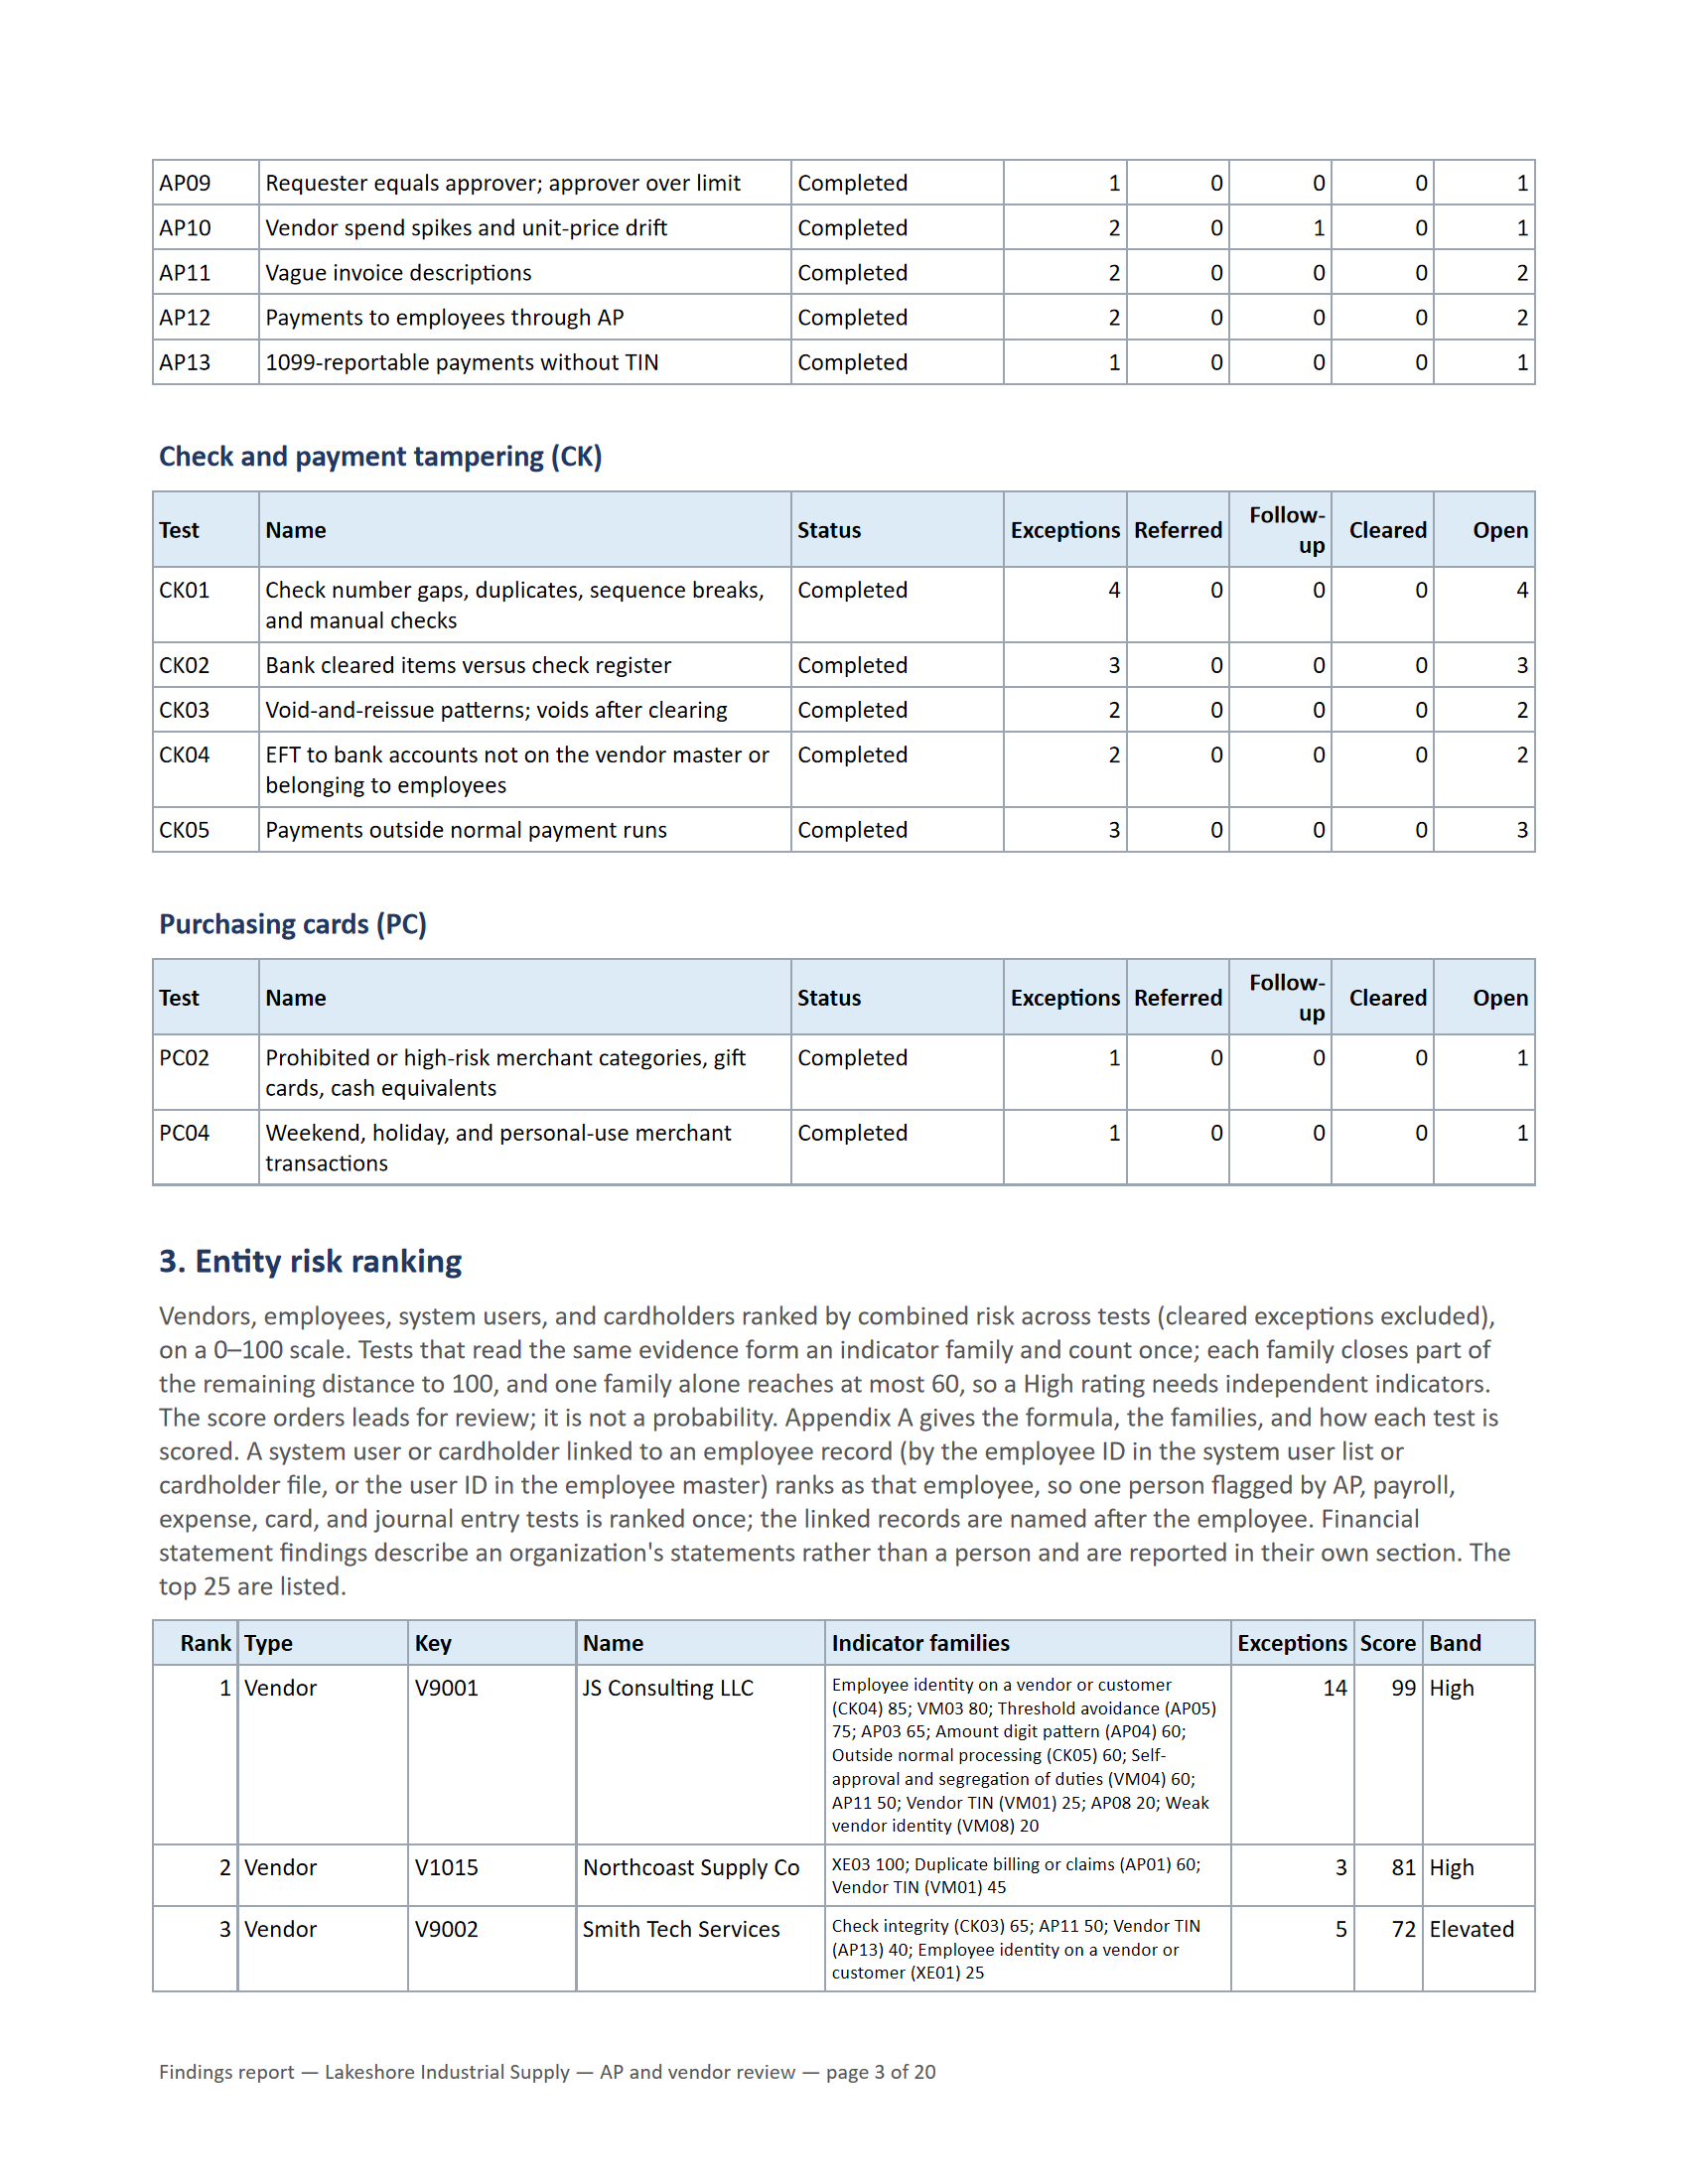
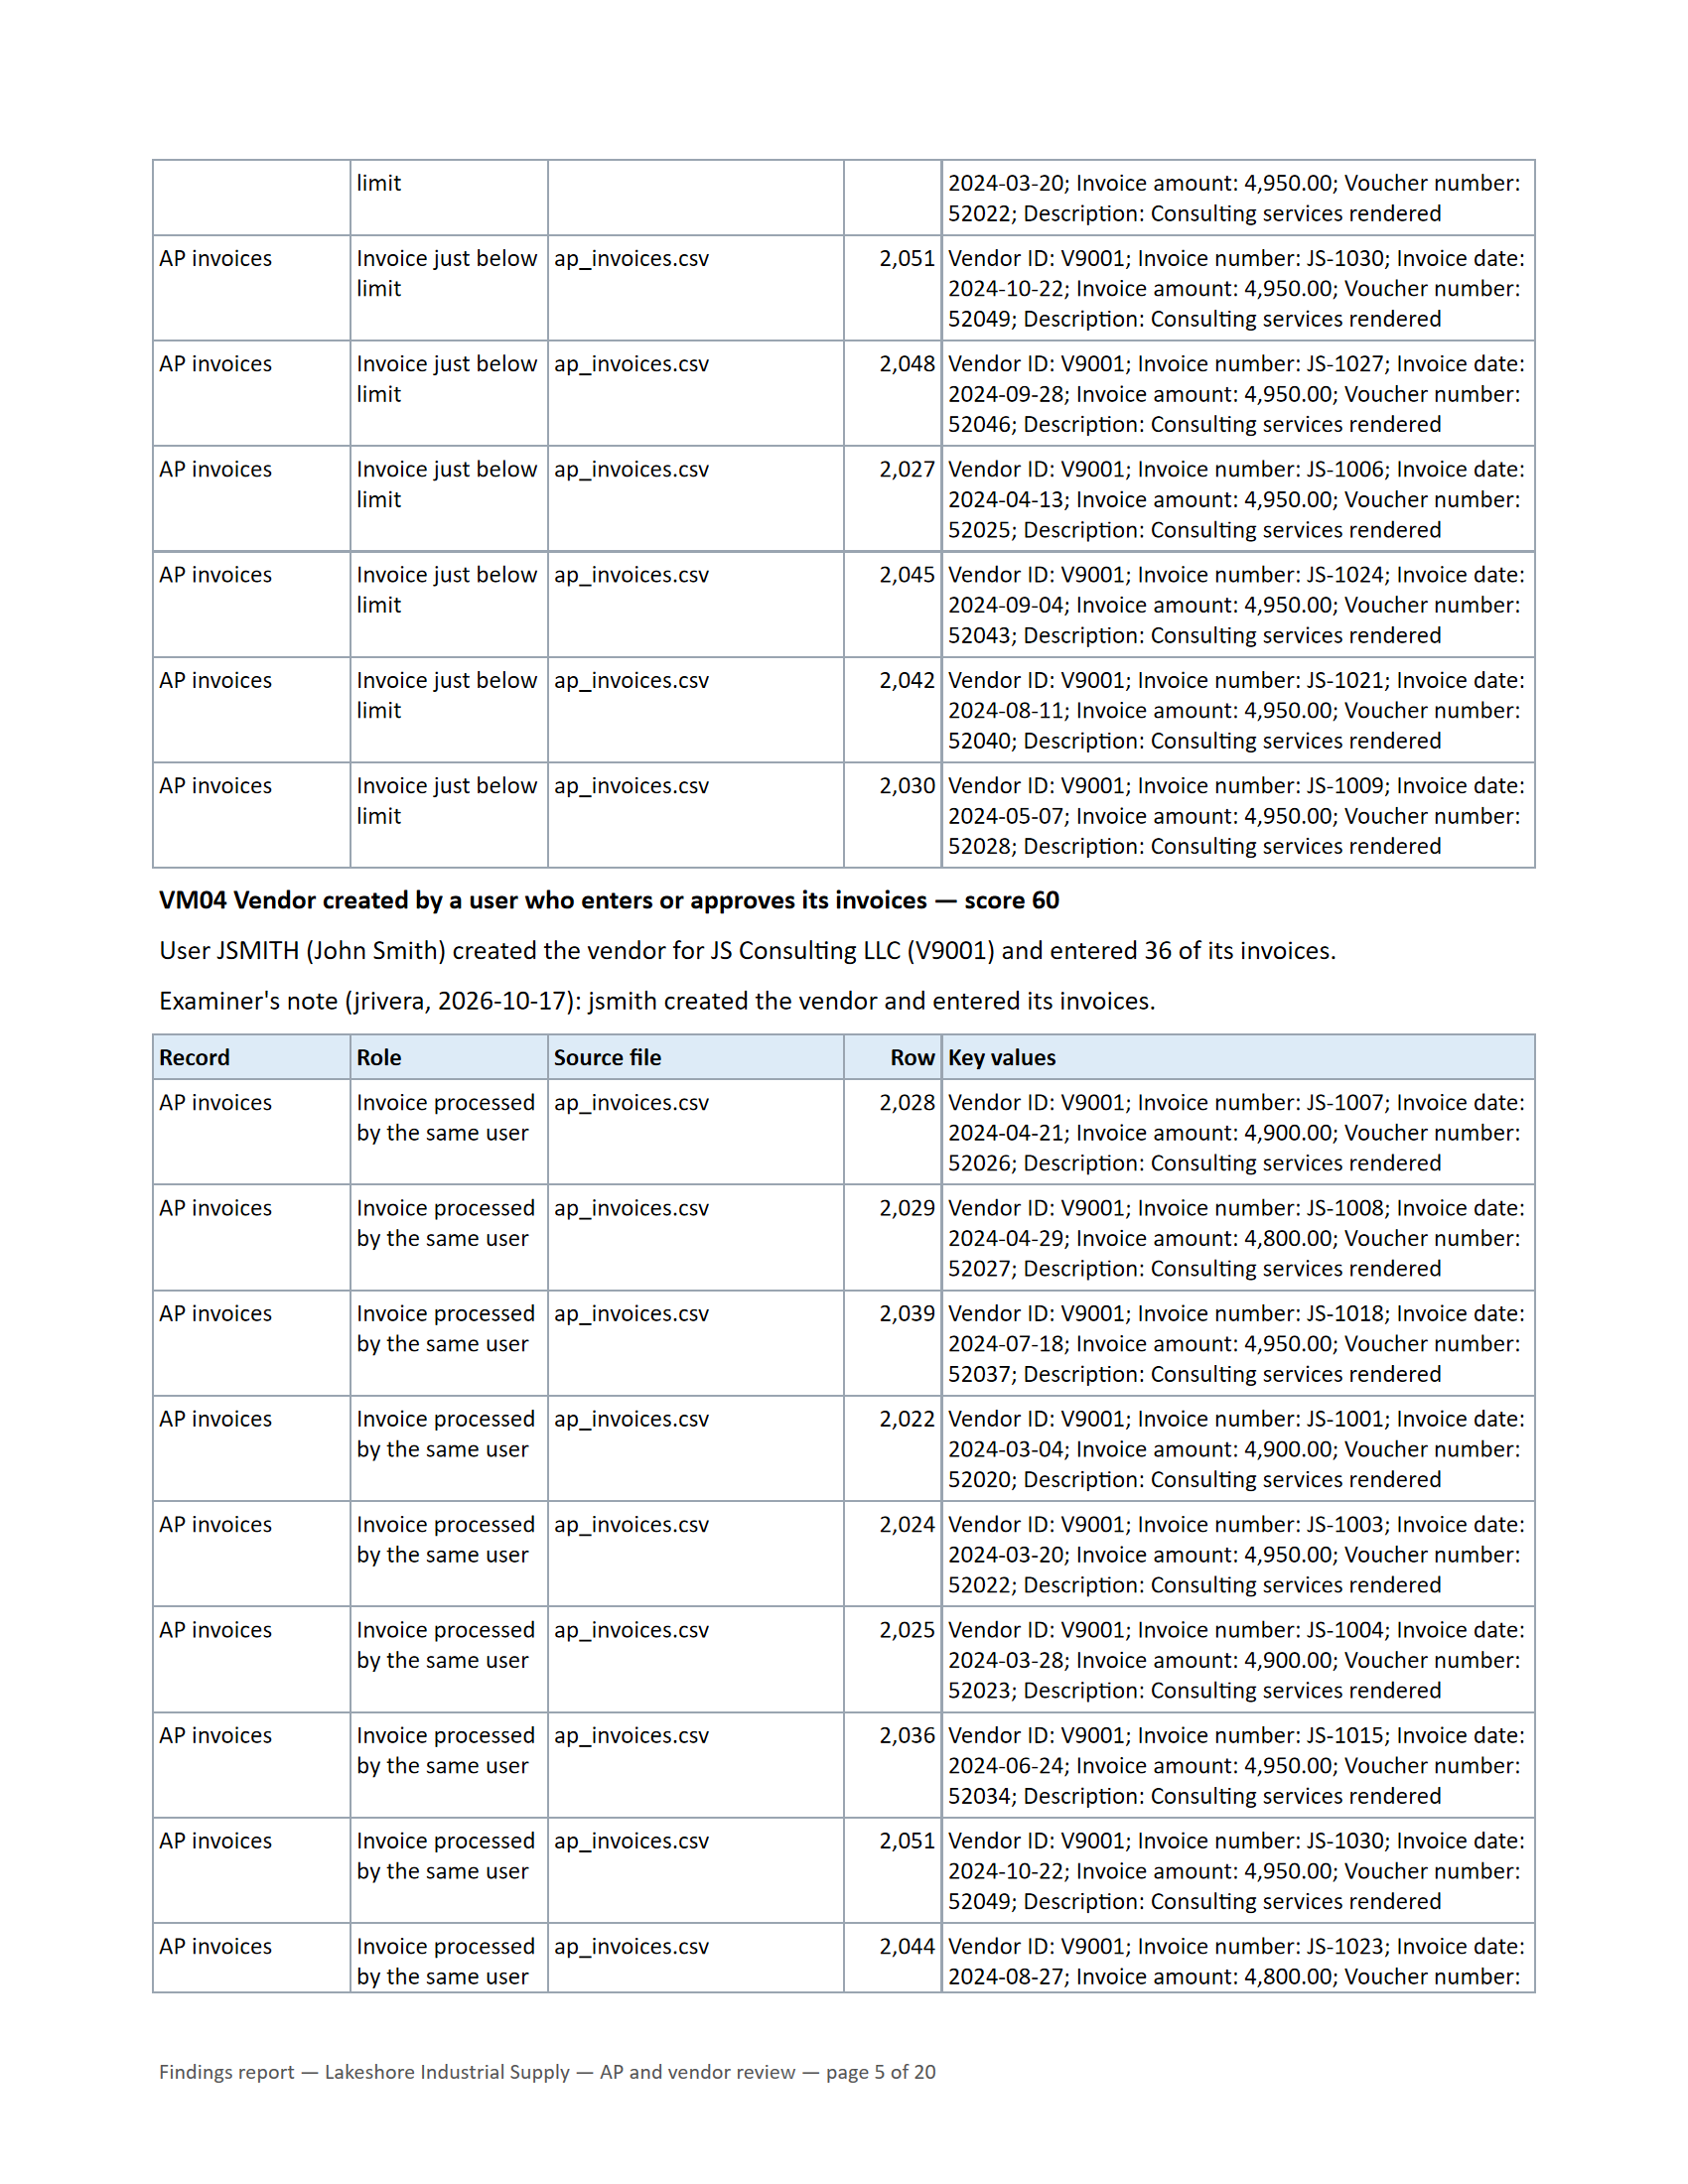
Review is three panes: the list, the exceptions, and the evidence with its disposition. Group the list by entity, ranked by risk, or by test. Results roll up into a 0–100 entity risk score from a published weight table, with related tests counted once. Drill down to the source rows, then disposition each exception as Cleared, Follow-up, or Referred, with notes.
// Step 7
Dashboards you can explain to your client.
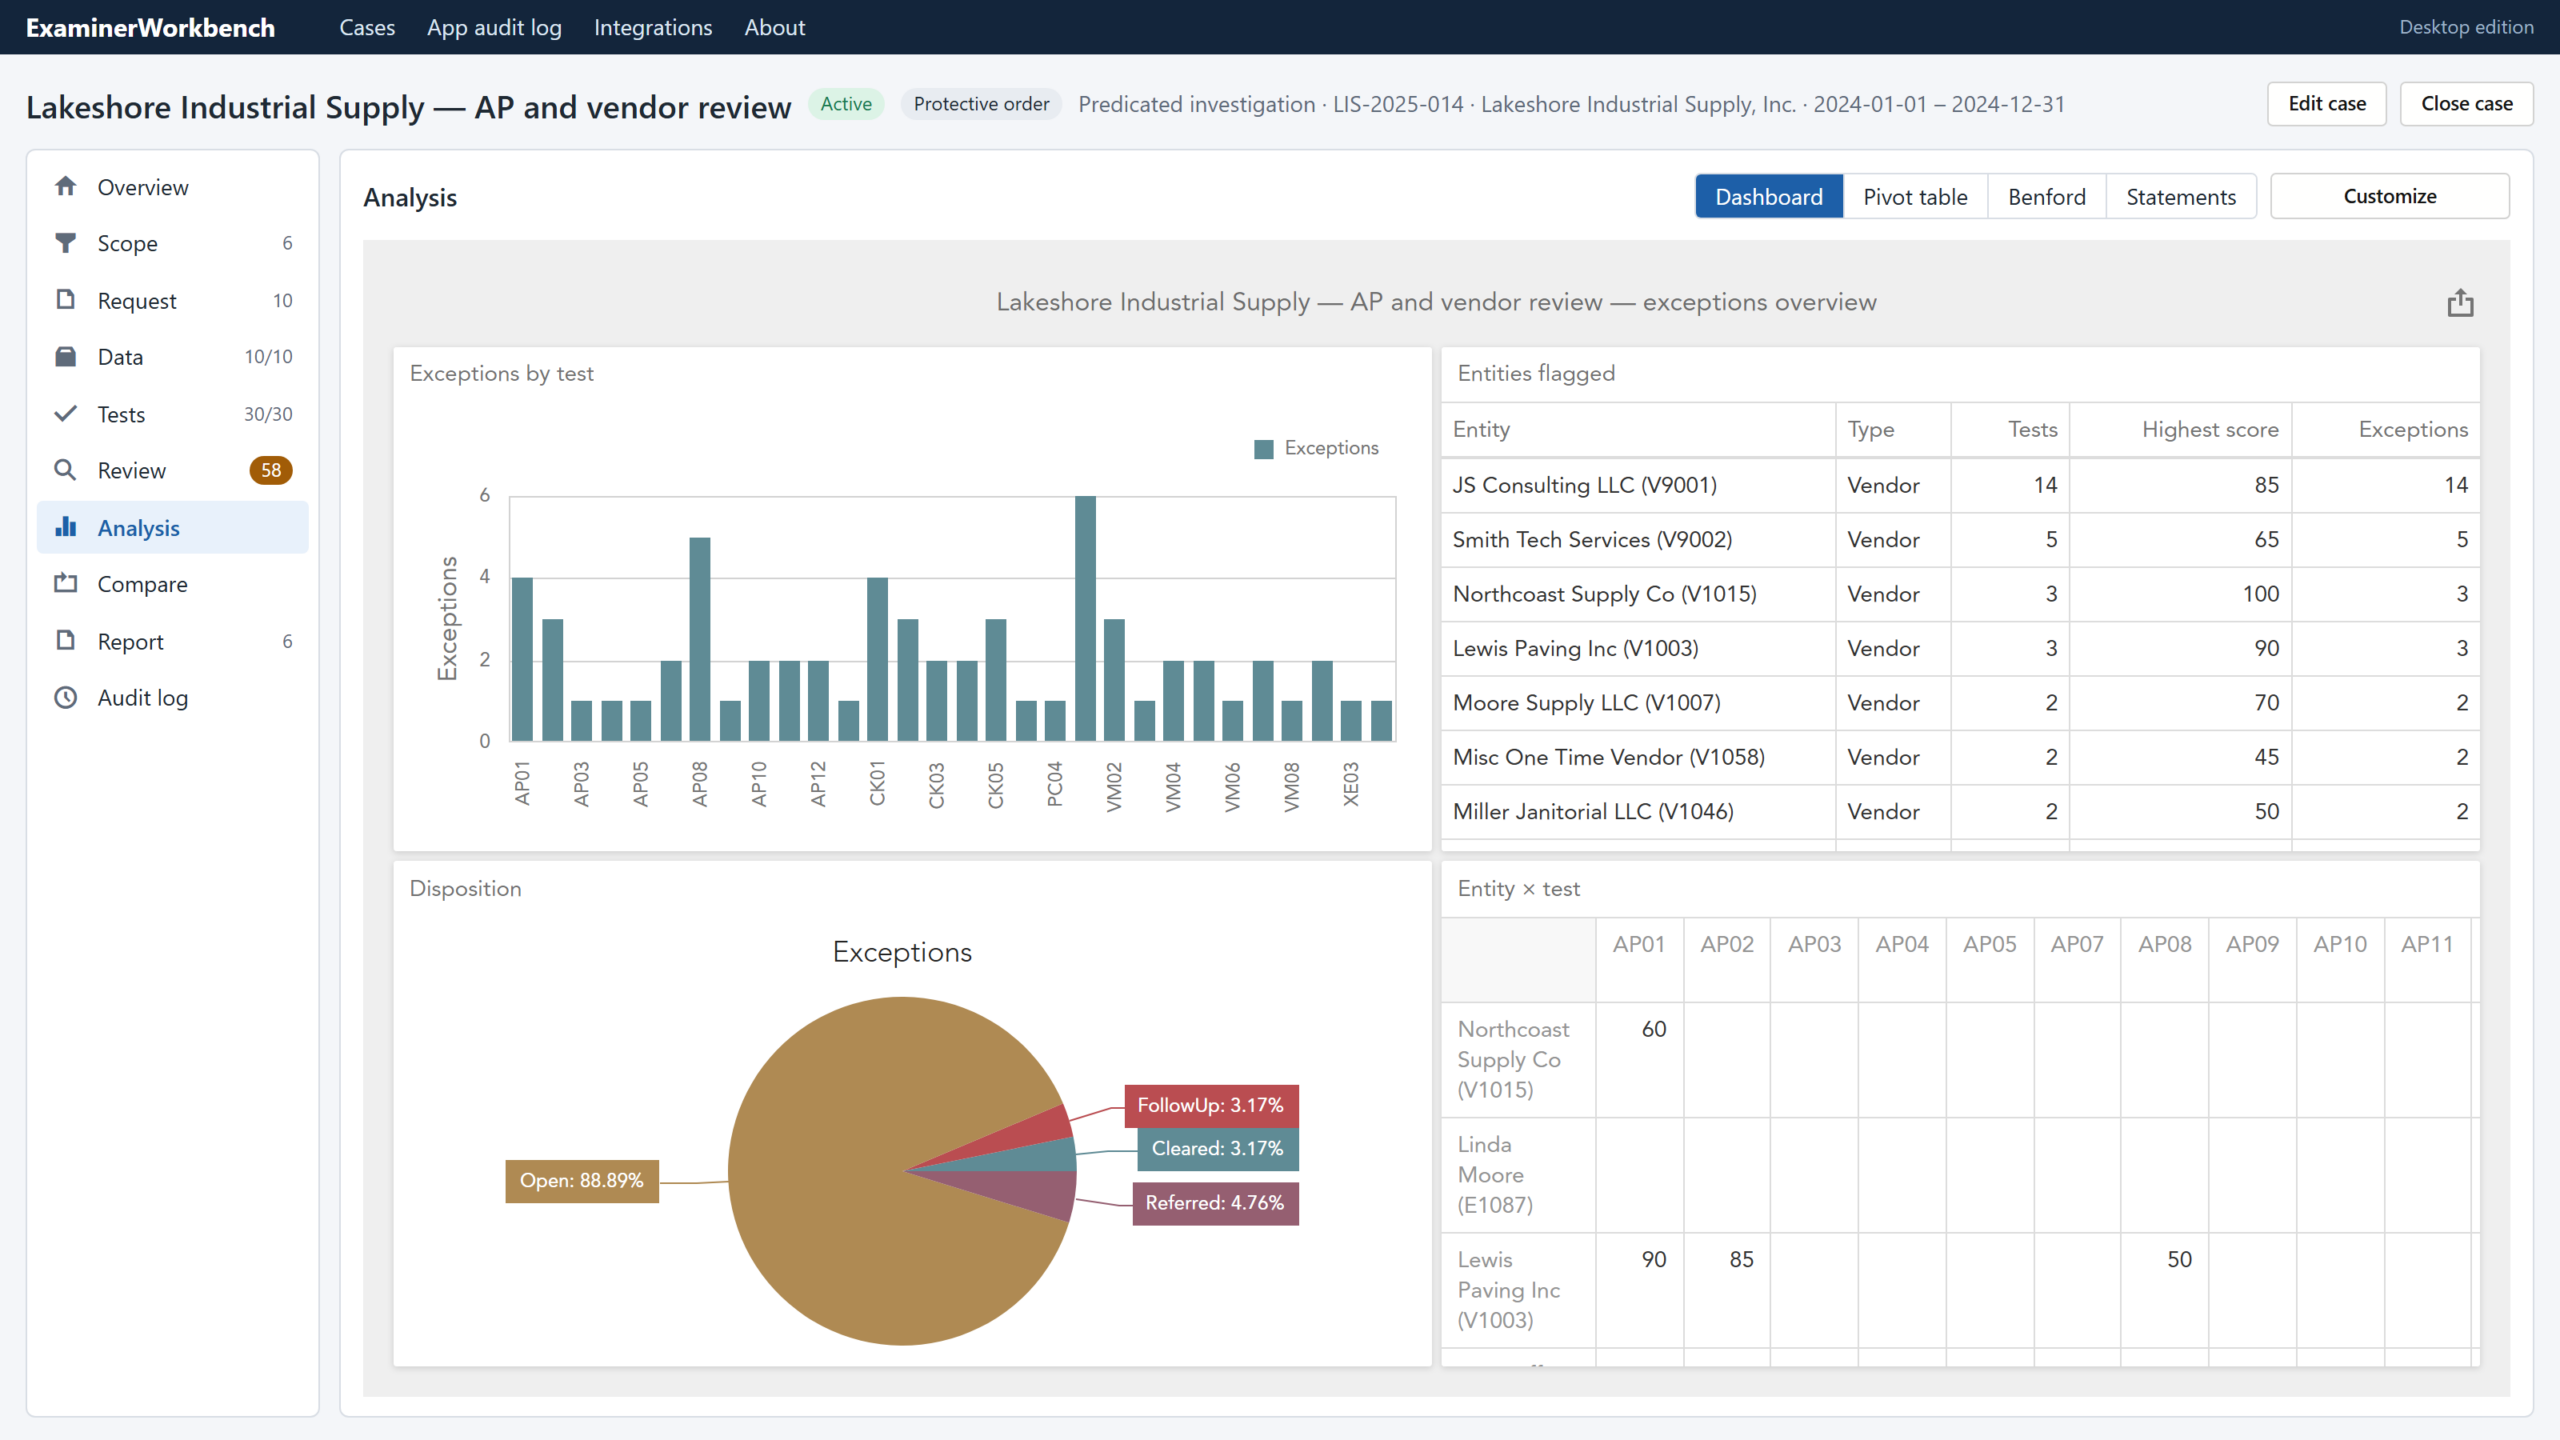
The Analysis step offers DevExpress dashboards and pivot tables: exceptions by test, disposition progress, and entities by test. Charts appear in context, so a Benford chart opens when you select a Benford exception. Risk scores are transparent weighted sums, with no opaque models.
// Step 8
Deliverables built from the work you recorded.
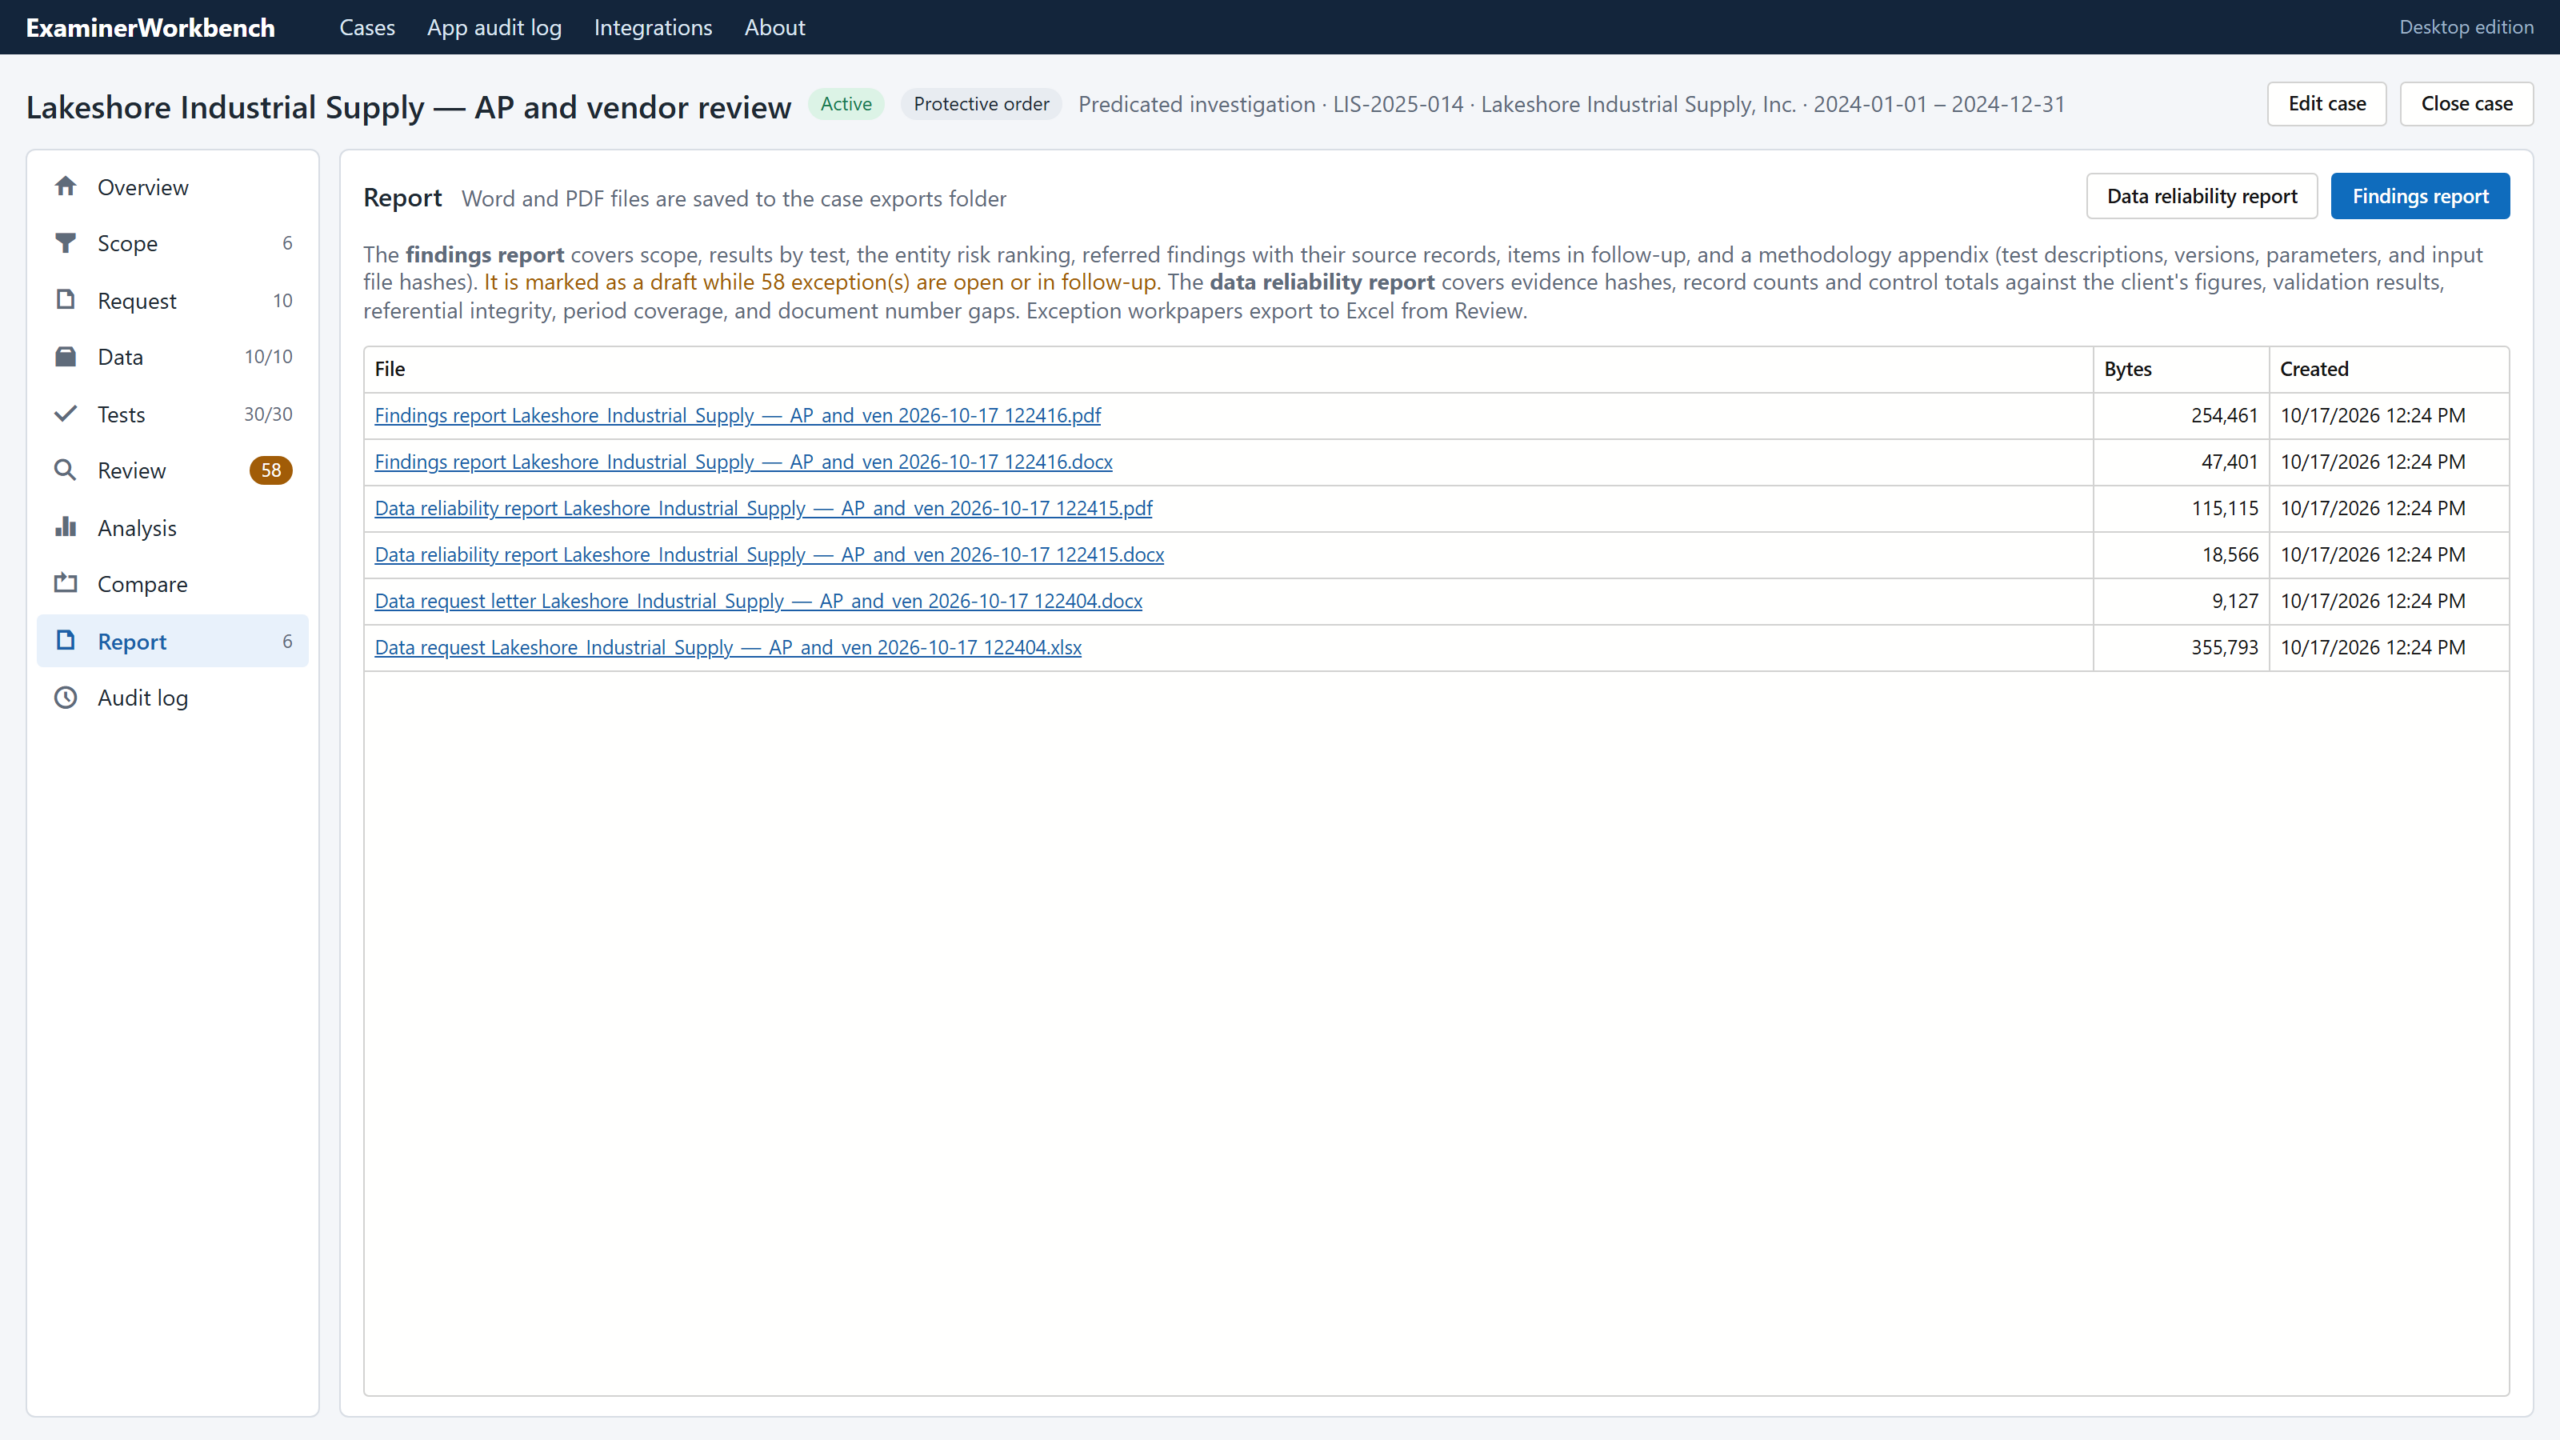
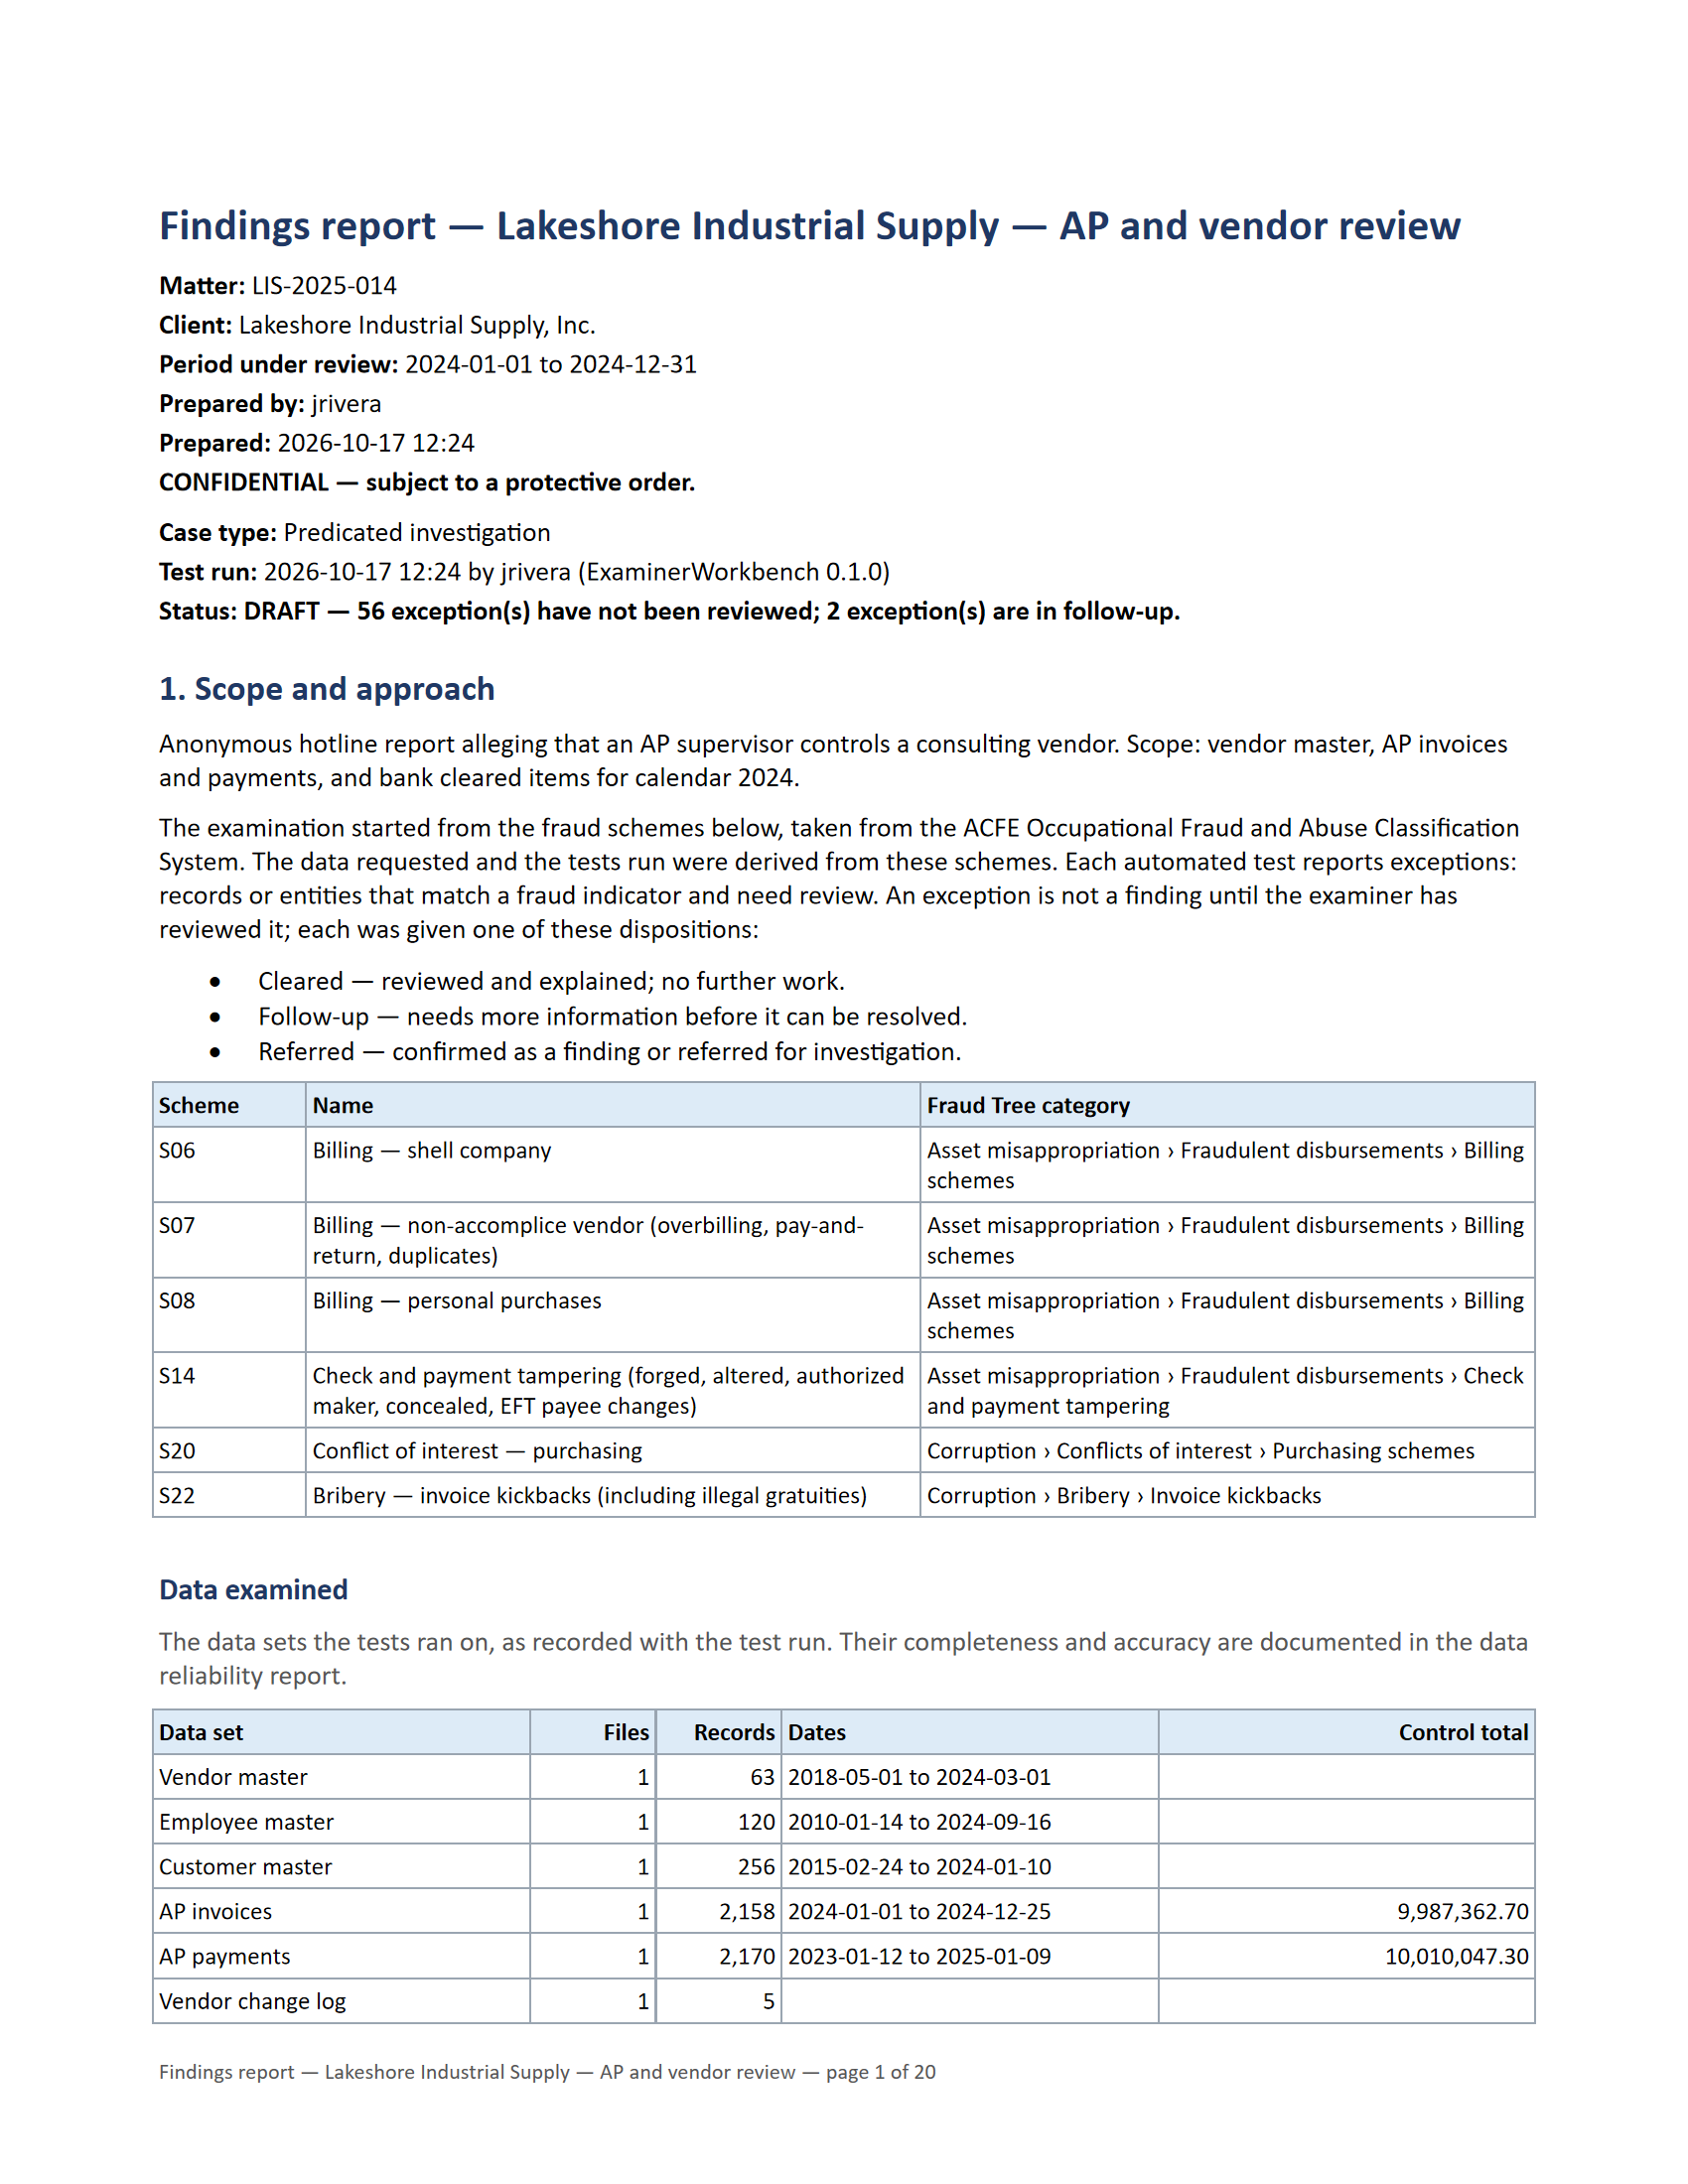
Produce a findings report with a methodology appendix, a data reliability report with file hashes and tie-outs, the data request letter with tracking and follow-up requests, and exception workpapers in Excel.
// Step 9
Reports you can hand to your client.
Each report records what was received, what was tested and how, so the work can be explained and defended.
// Local-first by design
Your case data stays with you.
ExaminerWorkbenchTM is a local-first Windows desktop application: case data stays on your machine, and no vendor-hosted service relays it. A Server edition for teams and firm-wide deployment is coming soon.
Buy now// By the numbers
A larger test library, built to scale.
The library has grown from a first set of vendor and payables checks to coverage across the main occupational fraud and financial reporting risks.
60+
Automated tests across fraud analytics and data reliability
31
Fraud schemes in the catalog, organized by branch and category
6
Starter packs that preselect schemes for common engagements
1M+
Rows per data set tested, with load times under 20 seconds
// Test library
Six areas of tests, each tied to the schemes it detects.
Every test states what it reads, what it flags and the common false positives, and every exception links to the source rows behind it.
Payroll
Ghost employees, falsified hours and falsified pay rates.
Expense reimbursement
Duplicate, inflated and fictitious expense claims.
Purchasing cards
Card misuse and personal purchases.
Journal entries
Management override: unusual timing, users, accounts and amounts.
Financial statements
Trends, ratios, the Beneish M-Score, reserves and understated earnings.
Data reliability
Control totals, GL and subledger reconciliation, and completeness.
// Workspace
A workspace that follows the examination.
A left workflow rail (Overview, Scope, Request, Data, Tests, Review, Analysis, Report, Audit log) gives each step its own screen, with no page scrolling.
Three-pane Review
List, exceptions, and evidence with disposition, side by side. Group the list by entity, ranked by risk, or by test.
0–100 entity risk score
A published weight table drives the score, and related tests are counted once so one pattern is not counted twice.
Linked entities
The risk ranking links related entities, for example a vendor that shares an address or bank account with an employee.
Analysis step
DevExpress dashboards and pivot tables, with charts in context. Select a Benford exception and the Benford chart opens.
Reports
A findings report and a data reliability report, plus the data request letter, tracking and follow-up requests.
// Data and evidence
Built for repeat engagements and defensible evidence.
Read-only data viewer
Browse every loaded data set with filters, grouping and Excel export. Each exception links to the source rows behind it.
Roll-forward and comparison
Roll a case forward and compare period over period for repeat engagements.
Account classification
Accounts are classified automatically as a suggestion, and you confirm or change each one.
Case settings export and import
Export test parameters from one case and import them into the next to keep your approach consistent.
Evidence handling
Every file is hashed (SHA-256) and logged in the chain of custody. Sensitive identifiers are hashed and shown only as the last four digits.
// Integrations
Connect it to the systems you already use.
Bring data in, push results out, and keep case data on your own machines.
Desktop Advanced and Server
REST API
Create cases, push data, run tests, read exceptions and risk rankings, write dispositions back, and download reports. Works with ETL jobs, scripts, Power Automate, and GRC or case-management systems. In the desktop edition it is off by default, listens only on the local machine, and requires API keys.
Coming soon · Desktop Advanced and Server
Source-system connectors
Extract data directly from the client’s accounting system, read-only. Each extraction is saved as evidence and checked against the system’s own trial balance. First: QuickBooks Online. Next: Microsoft Dynamics 365 Business Central and NetSuite. Later: SAP S/4HANA.
Local-first
No vendor-hosted service relays case data or holds connector credentials.